

You may have heard that the planet is committed to further warming and sea level rise, irrespective of what choices we now make to reduce carbon emissions. The global warming century trend that was observed from 1906 to 2005 was 0.74°C (with a 90% uncertainty range of 0.56°C to 0.92°C), with more warming occurring in the Northern over Southern Hemispheres, and more over land compared to oceans. Yet, based on our understanding of the climate impact of greenhouse gases (GHG) such as carbon dioxide (CO2), methane (CH4), nitrous oxide (N2O) and other trace gases, we should have observed even more warming than this. Actually, when you put all the pieces together, the expectation is for much more warming.
But before I tackle the critical issue of just how much more warming is still in the pipeline (in another post), it is important to explain the concept of carbon dioxide equivalents (CO2-e). This term initially confuses a lot of people, but it’s not really that difficult to grasp once it’s been explained.
To start, you need to understand that from a global warming perspective, we are interested in the changes in GHGs – which causes an energy imbalance. The pre-industrial and current concentrations of well-mixed long-lived GHG are 278 parts per million (ppm) for CO2 (now 383), 700 ppb (pp billion) for CH4 (now 1,775), and 270 ppb for N2O (now 320). Most of the other trace greenhouse gases (there are plenty), such as chloroflourocarbons (CFCs) and sulphur hexafluoride (SF6), are almost exclusively a result of industrial activity. Now to quantify their relative contribution to global warming, we need to find a way of putting all of these individual gases (and other climate drivers) on an equal – or equivalent – footing. That’s where CO2-e comes in.
The IPCC has two ways of expressing CO2-e. The first is known as concentration equivalence, which has units of ppm CO2-e. This definition asks: for a given change of a climate forcing agent (such as a greenhouse gas or aerosol), what change in the concentration of CO2 would have been required to have the same effect as the additions of this forcing? ‘Effect’ is here defined in terms of radiative forcing (RF), which is (loosely) the change in the amount of incoming (to Earth) versus outgoing (to space) radiation/energy, measured in watts per square metre (w/m2). A positive RF warms, negative cools.
The other way of representing CO2-e is by emission equivalence, which has units of the mass of CO2-e per unit time. For instance, you could define the climate warming impact over a 100-year period of 1 million tonnes (Mt) of methane as being same as if you’d released 25 Mt of CO2. If you shortened the time period to 20 years, that 1 Mt of methane would be the same as 72 Mt of CO2. The difference between time periods is because methane is more powerful GHG than CO2, but it breaks down more rapidly. This expression is also known as the global warming potential of a GHG.
Right. Now if you add up all of the GHGs (+100 ppm for CO2, +1,000 ppb for CH4, +50 ppm for N2O, and so on), and multiply each gas by its concentration equivalence, then you come up with a number of 455 ppm CO2-e for the atmosphere in 2005. Also, there is an uncertainty connected with the RF of each gas, due to incomplete scientific understanding. This means that the above quantity of 455 is actually just the average of a probability (statistical) distribution. I simulated this distribution in a computer, using the error bounds on individuals RFs given in AR4, and you can see the result in the figure at the top of this post (lower plot). 455 ppm CO2-e is our best estimate, but it could be less than 400 or higher than 500 ppm CO2-e. Hey, you ask, what warming does this commit us to? Well, you’ll have to wait for Part II for this answer!
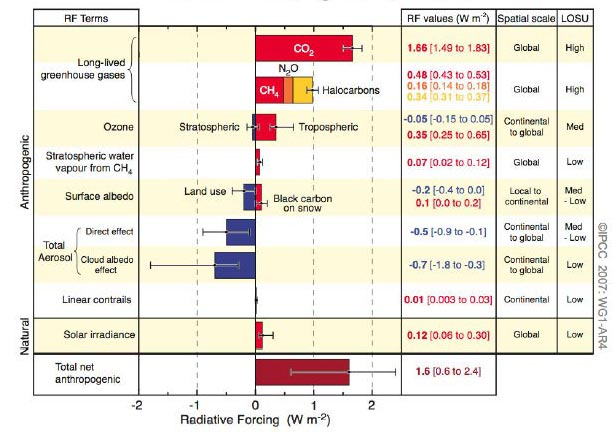
But here’s where the rub comes. If you want to understand what we are doing to the climate system right now, or indeed have been doing for the past few centuries, you can’t just look at changes in GHG. You need to consider all the other things, besides GHG, which can and do ‘force’ the climate (i.e., cause warming or cooling across the planetary system). Changes in the sun, for instance can have a positive (+ve) or negative (-ve) forcing effect. As can melting polar ice and snow (+ve), land clearance (+ve for the extra GHG, -ve for exposed land), aerosols (+ve for black carbon, -ve for sulphates, +ve or -ve for clouds). And so on… (More on this in Part II – for now, check out the figure to the right for a summary). Climate models, of course, consider all of these, and moreover, attempt to evaluate the effect they have on each other.
If you make the necessary calculation to add and subtract all of these climate forcings, then you get the total current concentration equivalence of CO2. This is 375 ppm CO2-e. By a queer coincidence, this number (at least the best estimate) is very close to the actual concentration of just CO2 alone (383 ppm). But the probability distribution is pretty wide – the true value of CO2-e could be as low as 300 ppm or as high as 450 ppm. The simulated distribution, using the IPCC RF error bounds, is also shown in the figure at the top of the post (upper plot). This value of 375 CO2-e is the actual forcing that is currently acting to warm the oceans, melt ice, and cause gradual upwards changes in average air temperature.
In brief then, we are NOT currently feeling the impact of 450 ppm CO2-e. Because of aerosols and other cooling factors, we are most probably experiencing the partial result of the extra energy being trapped by about 375 ppm CO2-e. Indeed, we are not even feeling all of that, at least in terms of changes in air temperature, because so much energy is currently going into heating large bodies of water and melting huge chunks of ice. But we will, given time, feel all of this and much more, if/when most of the cooling forcings start to go away (Part II)…
Of course, if you are technically minded or require more convincing beyond the few paragraphs of explanation I provide herein, I suggest you read chapter 2 of the IPCC Fourth Assessment Report (AR4), which has 106 pages on the topic of Changes in Atmospheric Constituents and in Radiative Forcing.
Or, for another take at this topic, BraveNewClimate reader Chris McGrath has made an excellent attempt to explain these concepts in simple terms, in comments posted here and here. I’ll reproduce them below (with some edited corrections), as they are very clear descriptions:
RealClimate gives a good explanation of carbon dioxide equivalents when used in terms of atmospheric concentrations rather than emissions at http://www.realclimate.org/index.php/archives/2007/10/co2-equivalents/.
Garnaut was referring to 455 ppm CO2-e in terms of the effect of all GHGs currently in the atmosphere without any reduction for the cooling effects of aerosols.
The IPCC (2007: 102) summarised the effects of GHGs and aerosols as follows:
“Atmospheric CO2 concentrations [reached] 379 ppm in 2005 … The direct effect of all the long-lived GHGs is substantial, with the total CO2 equivalent concentration of these gases [in 2005] estimated to be around 455 ppm CO2-eq (range: 433-477 ppm CO2-eq). The effects of aerosols and landuse changes reduce radiative forcing so that the net forcing of human activities is in the range of 311 to 435 ppm CO2-eq, with a central estimate of about 375 ppm CO2-eq.”
Here is my explanation of the background to these figures and the term “carbon dioxide equivalents” (Nb. I am lawyer, not a climate-scientist, so take this with a grain of salt. It comes from an article I wrote in a law journal last year):
——————-
For ease of comparison and modelling greenhouse gas emissions and atmospheric concentrations are commonly measured in a standard unit known as “carbon dioxide equivalents” (CO2-e or CO2-eq). This term is defined and used in slightly different ways in the context of emissions and atmospheric concentrations of greenhouse gases. The unifying theme for the different uses is that they allow the effect of different greenhouse gases to be compared using carbon dioxide as a standard unit for reference. It may be noted also that some authors and inventories refer to “carbon equivalents” when discussing quantities or atmospheric concentrations of greenhouse gases. Figures for “carbon equivalents” can be converted to “carbon dioxide equivalents” by multiplying by 44/12 to take account of the different molecular weights. Carbon equivalents can be a more meaningful term when considering carbon not held in the form of CO2, such as coal. However, the IPCC generally uses “carbon dioxide equivalents”.
When referring to greenhouse gas emissions, “carbon dioxide equivalent” refers to the amount of carbon dioxide that would give the same warming effect as the effect of the greenhouse gas or greenhouse gases being emitted. It is normally used when attributing aggregate emissions from a particular source over a specified timeframe. It is used in this way at national and international levels to account for greenhouse emissions and reductions over time. Article 3 of the Kyoto Protocol states targets for emissions reductions in terms of “aggregate anthropogenic carbon dioxide equivalent emissions of the greenhouse gases listed in Annex A.” Using this approach, Australia’s net greenhouse gas emissions across all sectors in 2004 totalled 564.7 million tonnes of carbon dioxide equivalent. The expected carbon dioxide equivalent emissions from burning different fuels can also be calculated using a standard methodology (see http://www.climatechange.gov.au/workbook/pubs/workbook-feb2008.pdf).
When referring to atmospheric concentrations of greenhouse gases, “carbon dioxide equivalent” refers to the concentration of carbon dioxide that would give the same warming effect as the collective effect of all of the greenhouse gases in the atmosphere. Put in a more technical way, this means the atmospheric concentration of carbon dioxide that gives a radiative forcing equal to the sum of the forcings from all of the individual greenhouse gas in the atmosphere.
Houghton (2004: 259) explains that when converting from carbon dioxide only concentrations to carbon dioxide equivalent concentrations, the amount that needs to be added varies with different concentrations of greenhouse gases as the relationship between radiative forcing and concentration is non-linear. For example, setting stabilisation targets of atmospheric carbon dioxide at 450 or 550 ppm would become about 520 or 640 ppm carbon dioxide equivalents, respectively, due to the additional warming effect of other greenhouse gases. Stern (2007) used the term in this manner. These approaches exclude the cooling effect of aerosols.
However, the use of this term is not uniform when discussing stabilisation targets as some authors define carbon dioxide equivalent concentrations as the net forcing of all anthropogenic radiative forcing agents including greenhouse gases, tropospheric ozone, and aerosols but not natural forcings. Hare and Meinshausen (2006) is an example of this approach. The inclusion of aerosols alters the meaning considerably. As noted earlier, the IPCC’s latest report indicates that the current radiative forcing of non-carbon dioxide greenhouse gases and aerosols effectively cancel each other, so that the net effect of all radiative forcing components is currently roughly equal to the effect of carbon dioxide alone. However, this offsetting effect is unlikely to remain in the future as improved pollution controls are expected to significantly reduce the cooling effect of aerosols over the course of coming decades: Meinshausen et al (2006).
With this context explained, it is understandable why Hansen et al (2008) prefer to use CO2 only targets and avoid the use of CO2-eq targets but for non-climate scientists (such as myself) we have to largely work with the approach adopted by the IPCC and international framework so we cannot avoid using CO2-eq. It is important to understand exactly what people mean when they refer to the term.
References:
Hansen et al (2008) “Target CO2 – Where should humanity aim?” (in review – see draft at http://arxiv.org/abs/0804.1126).
Hare B and Meinshausen M, “How much warming are we committed to and how much can be avoided?” (2006) Climatic Change 75: 111.
Houghton J (2004), Global Warming: The Complete Briefing (3rd ed, Cambridge University Press, Cambridge)
IPCC (2007), Climate change 2007: Mitigation. Contribution of Working group III to the Fourth Assessment Report of the IPCC (Cambridge University Press, Cambridge), http://www.ipcc.ch/ipccreports/ar4-wg3.htm
Meinshausen M, Hare B, Wigley TML, van Vuuren D, den Elsen MGJ, and Swart R (2006), “Multi-gas emissions pathways to meet climate targets” Climatic Change 75: 151.
Stern N (2007), The Stern Review on the Economics of Climate Change (Cambridge University Press, Cambrige).
And…
Tony states that, “Garnaut says Australia should establish its emissions reduction framework within an agreed global target to stabilise atmospheric carbon at between 450 and 550 parts per million (ppm): the present level is 387 ppm.”
Garnaut recommended aiming between 450 and 550 ppm carbon dioxide equivalents (CO2-e) and he states in his supplementary draft report (at page 29) “Today, the atmospheric concentration of greenhouse gases is about 455 CO2-e ppm (2005)”.
Garnaut is using CO2-e in a particular way. He is not talking about atmospheric carbon dioxide levels but the combined effects of all greenhouse gases and excluding the cooling effects of aerosols and land use changes.
Anyone who does not understand the difference between targets based on atmospheric carbon dioxide concentrations (which are currently at 387 ppm) and carbon dioxide equivalent concentrations needs to learn about these important terms if they are going to follow the policy debate on emissions reduction and stabilisation targets.
Carbon dioxide equivalents is a term used in different ways for emissions and atmospheric levels of greenhouse gases. Atmospheric carbon dioxide equivalent levels were around 455 ppm CO2-e in 2005 if you ignore the cooling effects of aerosols but around 375 ppm CO2-e in 2005 if you include the cooling effects of aerosols and landuse changes: see the IPCC (2007) Working Group III report at page 102, available at http://www.ipcc.ch/pdf/assessment-report/ar4/wg3/ar4-wg3-chapter1.pdf.
Well said Chris!
Part II of this series will look at a new paper published recently in PNAS on committed warming, which I think, once explained, will blow your mind…

26 replies on “How much warming in the pipeline? Part 1 – CO2-e”
Hi Barry,
Great website, have really gotten a lot out of it over the past few weeks.
Just wanted to get your perspective on the idea of pumping sulphur into the atmosphere as a means of planetary cooling? (as proposed by the Dutch scientist Crutzen).
Cheers,
Damien.
LikeLike
Damien, see: https://bravenewclimate.com/2008/08/07/geoengineering-damned-if-you-do-damned-if-you-dont/
I’ll also discuss Geoengineering again in Part IV of the How much warming in the pipeline? series.
LikeLike
Somewhat OT, but too good not to link to:
There is no evidence of human-induced financial crisis!
LikeLike
“uncertainty with the RF of the gas” might be seized on by deniers who will wrongly
interpret it as an admission of ignorance when it is really just a
shorthand way of saying that a tonne of any gas has an atmospheric lifetime and impact which will
depend on plenty of chance events such as where it was emitted, what the temperature
was at the time, etc etc and we can compensate for imperfect information by using probability
distributions.
LikeLike
Barry,
Do You think that with an 800% increase in ACO2 and no net warming we shouldn’t remain just a little sceptical?
http://icecap.us/index.php/go/joes-blog/is_this_the_beginning_of_global_cooling/
LikeLike
Spangled Drongo.
Please show everyone here the working, with numbers, to substantiate your “800% increase in ACO2 and no net warming” claim.
Please.
LikeLike
Spangled Drongo, it is important to be a critical thinker by keeping an open mind and sifting through all of the evidence both for and against anthropogenic climate change without ideological blinkers or a pre-conceived answer but to do that you have to get your facts right. I have no idea where you get “an 800% increase in ACO2” from but your “no net warming” claim is not correct. Have a read of the New Scientist article, “Climate Myths: Global Warming Stopped in 1998” at http://environment.newscientist.com/channel/earth/climate-change/dn14527-climate-myths-global-warming-stopped-in-1998.html.
LikeLike
Joseph Romm at Climate Progress has a very insightful comment on the lessons from the US financial crisis for climate policy: “Is 450 ppm (or less) politically possible? Part 7: The harsh lessons from the financial bailout” at http://climateprogress.org/2008/10/07/is-450-ppm-politically-possible-part-7-the-harsh-lessons-of-the-financial-bailout/#more-3953.
He suggests that the lessons from the US financial crisis are that the pre-conditions for massive, rapid government action are:
1. Multi-hundred-billion-dollar-sized government action happens only when there is a very, very big crisis.
2. A necessary, but not sufficient, condition for a crisis to be “very, very big” is that it must be labeled as such by very serious people who are perceived as essentially nonpartisan opinion leaders.
3. In addition, bad things must be happening to regular people right now.
4. The credible people must say that the government action is going to solve the problem.
He concludes that “450 is not politically possible today. Nor is 550. Nor is action sufficient to stave off 1000 ppm and 6°C warming.”
His point about the need for a crisis and bad things happening remind me of the Stockholm Network’s “Step Change” scenario for radical change in future climate policy driven by the occurrence of stochastic weather events such as major droughts. We’ve seen that sort of approach on water policy in Australia in the past decade.
Unfortunately, until we reach that crisis point, the Stockholm Network’s “Agree and Ignore” scenario seems much more likely: http://www.stockholm-network.org/Conferences-and-Programmes/Energy-and-Environment/carbonscenarios
LikeLike
Hi Barry,
I think you got your units wrong for N2O – At ppm we’d be in a whole lot of trouble since the gwp is around 300 times that of CO2. It should be ppb.
LikeLike
Spangled Drongo at #5.
What’s the go with the ‘trendline’ on that graph? It certainly isn’t a moving average. It looks to be a polynomial fit, and least a cubic and possibly a higher order. That’s not science, that’s dredging, in an attempt to give an unjustifiably large drop at the end of a graph that will continue to extend with time.
I think you’d find it one applied Tamino’s time series rigour to the data there would be a trend upward with only a bit of downward noise in the last year. Time series data should not be treated with high order polynomials to describe the ‘ends’ of the dataset.
If anyone should be sceptical it should be you, with respect to the distorted analyses you seem to rely upon.
LikeLike
Thanks Ryan for correcting that typo!
LikeLike
Barry,
Can you clarify whether the world is currently on track for over 1000 ppm atmospheric CO2-e based on business as usual? As you noted in a recent post, global greenhouse gas (GHG) emissions are increasing at over 3% a year at the moment (https://bravenewclimate.com/2008/09/26/ongoing-rise-in-global-carbon-emissions-and-the-lazy-audience/) which put us on track for a 150% increase in emissions between 2000 and 2050.
Looking at Table SPM-6 on page 20 of the IPCC Synthesis Report (http://www.ipcc.ch/pdf/assessment-report/ar4/syr/ar4_syr_spm.pdf) an increase in emissions of 140% by 2050 (compared to year 2000 emissions) puts us on track for atmospheric GHGs and aerosols around 1130ppm and rises in mean temperatures of over 6 degrees Celsius.
Kind regards
Chris
LikeLike
Chris – I think you answered your own question quite well. Yes, we are on track for 1000+ ppm – even before carbon cycle feedbacks (permafrost melt, declining/collapsing oceanic and terrestrial sinks) kick-in, which were only marginally considered in those IPCC A1FI scenarios.
But really, by the time we’ve crossed 750ppm, there’s no chance for our society, so the planet can have a carbon party after that and humanity won’t be around in a civilised form to give a rat’s. The 300-400ppm range is sufficient to trigger major adaptation challenges and costs, and the 450-650ppm range is enough to push us to or beyond the limits of adaptation.
LikeLike
Thanks very much, Barry. This is exactly what I was after.
Cheers, Darren
LikeLike
Barry, will the recent Pacific Decadal Oscillation shift mask some (or a lot) of the warming in the pipeline? . If the timing of such cycles combine to mask warming, can we reasonably conclude that when those cycles swing back and warming influences coincide there’ll be a lot of apparent warming over a short period? Watching the rises and falls in global temp graphs never seemed to me to be representative of the underlying state of the climate, particularly when only simplistic comparisons are made – with CO2 levels for example, (or solar cycles).
Whilst I know that it’s not as simple as correcting such graphs for known effects like ENSO, PDO, and other natural cycles to see what’s left, do such methods have a significant place or does it quickly get so complicated only a supercomputer running a GCM can keep track of them all? It seems like the former method is the mainstay of climate change skeptics (almost always with a single or very few, rather than all known) effects taken into consideration and usually with the intent of showing some expected change hasn’t taken place – ie to “prove” science has it wrong.
Also, what’s happened in the Arctic seems to indicate IPCC projections hve underestimated significant impacts. Can we expect to see better understanding and better predictions from looking at why? Any time soon?
LikeLike
[…] pipeline’ is a term used to describe lags and inertia in the climate system. As explained in my previous post on this topic, the planet is committed to further heating and sea level rise, irrespective of what choices we […]
LikeLike
There is “no more warming in the pipeline”.
http://climatesci.org/2009/03/05/is-there-climate-heating-in-the-pipeline//
Sorry…
LikeLike
Individuals CAN prevent Global Warming
I am not completely convinced CO2 has anything to do with Global Warming. That notwithstanding, I am certain that reducing our reliance on fossil fuels is both a good idea and necessary, for a large number of obvious reasons.
The good news is that we can all make a difference. It goes way beyond buying a few (polluting) low energy light bulbs, and will have a real impact if even half of those concerned about Global Warming follow the proposals. The beauty is that even if only half do this, it makes no difference what the rest do! Renewable energy will become cheaper than fossil fuels with enough investment in the technology, and everyone will move over naturally!
Firstly, buy renewable energy.
As far as I am aware, you have the choice to buy renewable electricity in all developed countries. If you cannot now, you should campaign for that inalienable right immediately. Currently our own household buys 25% of our electricity as renewable, costing us about US$33 extra per year. 100% would cost US$183)*.
Some argue that if millions of householders (and industries, I would hope) buy renewable energy, there will not be enough. If you do not buy it, there will NEVER be enough. If you do, the money will be used to INVEST in infrastructure for future renewable energy, so making the expense just as effective.
Merely by choosing to buy this, you are immediately and directly investing in the renewable energy industry, and sending a powerful and undeniable message to those who matter, the people who actually generate electricity, not environmentalists or politicians who may have different agenda.
Secondly, stop investing in ‘Big Oil’ and ‘Big Coal’.
It comes as a shock to many ordinary citizens to be told that the huge greedy corporations actually make money for THEM, not for some faceless consortium. Sure, corporate flunkies may make millions of dollars, but WE, as investors, make billions, and even trillions. Their huge payouts and massive junkets are insignificant compared to the profits the companies make for their investors.
You may well think that you do not invest in these companies, but if you have a pension or investment fund, you almost certainly do. These funds will, quite obviously, be invested in the very companies that make the most profits and returns for their investors. All these corporations are doing is actually acting effectively YOUR instruction, ie to get the best possible return. If WE stop investing in them, they fail, and will be forced to change their practices to survive in a capitalist environment.
The answer is to choose ethical investments (there may be different names). Talk to your financial adviser and make the switch now. ONLY YOU control your investments. Make the choice and stop letting others do it for you.
The message is that YOU control the future of energy production with your wallets. The bad news is that it will cost, but nothing the environmentalists or governments will ever do about this issue will cost you less than this, and most of what they want to do will take control away from you and waste most of your expenditure in bureaucratic bungling and misguided foolishness, in my opinion. This simple two-step approach has all the potential to work and with no complex side effects that I can see immediately. It has a direct and immediate effect.
It is so rare that we are able to do something so straightforward in this complex world. If Global Warming concerns you, I urge you to put your money where your mouth is, and make an immediate difference TODAY, before the power is taken away from you.
* Based on a usage of 5,000 kWh of electricity.
Source: http://www.originenergy.com.au/1142/Green-energy-FAQs#extracost
http://www.carbonclimate.info/2009/03/individuals-can-prevent-global-warming.html
LikeLike
In this and other articles dealing with global warming, there is a disturbing tendency to view atmospheric aerosols, as beneficial because of their cooling effect.
Scientific evidence of catastrophic global weather events created by huge palls of smog is rapidly gaining credibility.
Instead of aerosols being considered helpful in reducing temperatures, they should be recognised as being extremely harmful, even more so than rising CO2 levels, and urgent steps should be taken to eliminate those with anthropogenic origins.
LikeLike
NA #19: You are right, tropospheric aerosols from fossil fuels are incredibly bad for human health and other environmental impacts (black carbon soot, acid rain, radioactive emissions, mercury poisoning). It is nothing less than a great irony that they also have a cooling effect. A situation of damned if you do, damned if you don’t. There is no obvious answer, unless you look to stratospheric aerosol cooling — in the stratosphere, you’d need about 10% of the sulphates you’d require in the troposphere for the same cooling effect. Yet such geoengineering carries its own risks and uncertainties.
LikeLike
Thanks for the long and tedious explanation illustrating the often ignored fact that all Global Warming models/constructs/etc, still cannot avoid arbitrary (human) assumption in order to make a statistical in the absence of defined and demonstrable causal mechanisms.
This article WAS intended to illustrate the shortcuts and shortcomings in climate ‘science’ right? Well done.
LikeLike
Thanks for your praise and insight, Dubl D…
LikeLike
As I understand it:
* How much warming is in the pipeline?, is equivalent to How much ‘unrealised’ warming is in the oceans?.
* As Barry has explained in elsewhere, as things stand we lack the necessary data on changes in ocean warming.
Surely therefore we lack the necessary data to comment on what if any warming exists in the pipeline?
LikeLike
Yes, it’s partially about how much inertia there is in the oceans (and its ultimate transfer of some of this energy back to the atmosphere) — this is tough to estimate, with a best approximation of about 0.5C. It’s also about how much warming is being masked by aerosols (best guess is that we should have experienced about 50% more atmospheric warming than we’ve actually seen, due to aerosol masking). This is what is covered in Part II of this posting.
LikeLike
[…] it takes several decades for the temperature to catch up with the new energy imbalance (see here, here, and here for explanations). So even if you stopped all CO2 emissions today, there […]
LikeLike
Reblogged this on Dispro Tech Sa.
LikeLike