
 This is part II, on impacts of climate change. Be sure to read climate change basics I – observations, causes and consequences, and for more on pragmatic energy solutions, see here.
Climate change impacts on ice, rain and sea level
The term “global warming” says it all – a heating of the atmosphere right across the world. But that does not mean that the warming, or its impacts, will be the same everywhere. Regional and local differences can cause things to be worse, or better, depending on where you are.
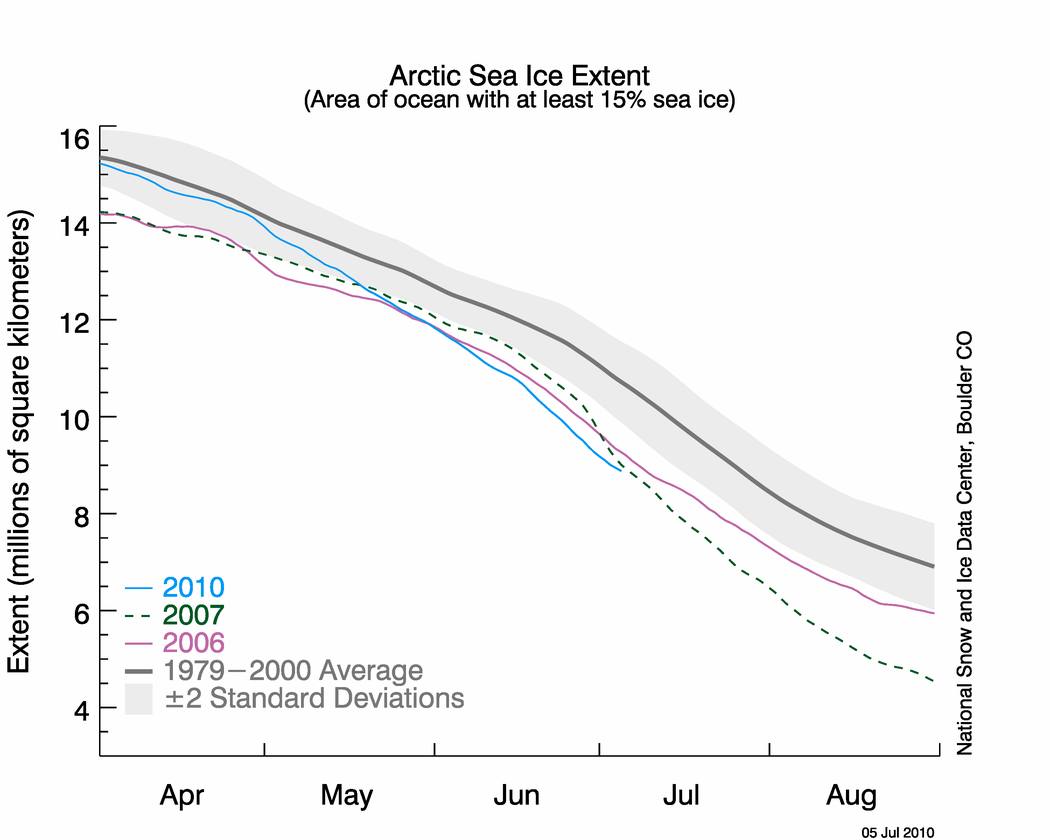
One example of this unevenness is in the Arctic. Snow and ice melt over progressively larger areas and for longer periods as the temperature rises, causing the Earth’s surface to be duller. Bare rock, soil, vegetation and the open ocean are all much darker than bright ice, and so, just like the dark panels on solar hot water systems, absorb substantially more sunlight. This leads to greater heating, more melting, and so on – just one example of an amplifying feedback that can make global warming worse that it would otherwise be. There are many other such feedbacks, some of which remain poorly understood and could lead to more severe and more rapid warming than expected.
 Perhaps the biggest regional impact of climate change faced by mid-latitude temperate regions (where most of the ‘developed nations’ are located), is, ironically, shifts in tropical-equatorial weather systems. Global warming causes the overturning tropical air masses that circulate in giant loops (called Hadley Cells and the Walker Circulation) to expand north and south. This has been recently shown to have happened already – up to 2° of latitudinal expansion over the last 30 years. Atmospheric heating also causes polar winds to whip around the Southern Ocean more rapidly. Together, these effects of global warming act to push rain-bearing mid-westerly weather systems further north and south. So instead of places like southern Australia being doused in rainfall brought in from the Indian and Southern Ocean, progressively more of this rain will be dumped uselessly over the sea, below the continental margin. This means less rainfall for Australia’s agricultural areas, as well other mid-latitude regions such as South Africa, the Mediterranean, Mexico and the western United States.
With less rain in these areas, the vegetation and soils will dry. In combination higher temperatures, the risk of bushfires intensifies. Heatwaves are the most dangerous culprits in this relationship. The 15-day March 2008 heatwave in Adelaide was, on the basis of the 20th century temperature record, a staggering 1 in 3000 year event. Yet under a mid-range projection of global warming (should no action be taken to quickly curtail carbon emissions), such an event would be an expected part of an average summer.
Such heatwaves and regular intensive fires also causes great stress to most species, leading to higher mortality, failed reproduction, and reduced body condition. These synergies, between water availability, hotter temperatures and changed fire regimes, are some of the primary reasons why unrestrained climate change is anticipated to lead to the extinction of an appallingly large fraction of our biodiversity. [climate change basics III will explain more about this]
Sea level rise is a more universal threat. When salty seawater mixes with fresh groundwater, the result is diluted seawater. A once usable water resource becomes worthless, with obvious impacts on coastal drinking and irrigation water supplies, as well as ecosystems which tap into aquifers. Severe storm surge events occasionally result in this exchange, but if these events are rare and do not encroach too far up the shoreline, the impacts are generally minor and localised. But what if the frequency of flooding events from the sea were to increase dramatically, and do so across the entire coastlines of heavily populated nations with expensive waterside properties or valuable low-lying agricultural land? That ominous threat is just what is anticipated due to climate change, and should therefore be a major concern to coastal planners and beachside residents alike.
There is clear evidence that sea levels have risen over the past century. Long-term records from a globally distributed network of reference tidal gauges show that sea levels rose about 20 cm from 1870 to 2004, correlating with a globally averaged rise in temperature of about 0.8°C. Since 1992, a satellite monitoring system has made regular and precise measurements of sea level, which show an accelerating rise over the last decade. If the Greenland and West Antarctic ice sheets hold together, the most recent estimates suggest another 50 to 140 cm of sea level rise this century. A worst-case scenario, now being predicted by some eminent scientists, is 3 metres by 2100 should the polar melt continue to accelerate. Yet, even 50 cm would be enough to make a 1 in 100 year storm surge event a yearly occurrence.
The need for action is urgent and our window of opportunity for avoiding severe impacts is rapidly closing. Yet the obstacles to change are not technical or economic, they are political and social.


28 replies on “Climate change basics II – impacts on ice, rain and seas”
Thank you very much for writing these posts Barry.
This blog has a long story arc and we have cycled from climate change, arguing with deniers, discussing the impacts through energy, renewable and otherwise, economics and policy, food and agriculture, through implementation practicalities and plans to deal with our present situation.
Its been a while since we’ve looked at climate change itself, and its a good time to circle back and remind ourselves why we are talking about these other matters, to understand what is at stake, to put competing concerns in perspective, and appreciate why we will argue long into the night for energy solutions that can be relied upon.
For those who prefer the ghost of climate future to visit in aural form, I highly recommend these podcasts by Barry, and Corey Bradshaw:
Corey Bradshaw on marine impacts
Barry Brook on the impacts of climate change
LikeLike
I think even Blind Freddie can see something is awry with weather patterns. Winter 2009 in Tasmania was the wettest since the 1920s. Winter 2010 is shaping up to be the driest on record. That’s why on other threads I’ve wondered what is to be done about chronically low hydro dam levels in the future. There are even more implications for forestry and irrigated farming. When AGW deniers talk about medieval vineyards or whatever I wonder if they are choosing to be thick.
With just 0.8 degrees of warming adaptation is getting to be a major stretch. Heaven help us with 2C and more. My adaptation plans include more water storage and a roomier underground cellar. The idea is to invest now and save on water and power bills later.
LikeLike
As climate changes, sea levels rise and fall; the distribution of rainfall also changes. Here’s a well documented historical example.
During the Roman Warm Period the rainfall in North Africa was much higher than it is today. The area around modern Tripoli was highly productive farm land supporting the sophisticated society that built Leptis Magna, rivalling Alexandria by 200 A.D.
At the end of the RWP, the weather turned much drier in much of north Africa and by 500 A.D. Leptis Magna was a ghost town.
It is no accident that most major cities are located near productive farm land. It always has been that way and it always will be until we find out how to produce food independent of the climate. When the climate changes city dwellers are sometimes forced to move to where the food is.
The same goes for sea levels which have been 200 feet higher than today and 400 feet lower. These sea level changes occurred before humanity evolved and will doubtless continue after our species has become extinct. To suggest that we have a significant effect on global climate ignores history and exaggerates the power of the human race.
Cold periods with heavy glaciation are also periods of low precipitation. Conversely, interglacial periods are associated with high precipitation. It is simply a matter of how much water vapour can get into the atmosphere. Thus if the climate gets warmer there will be more rainfall and snow falling globally even though some zones may become drier than they are now.
As I have said before “Don’t Panic”, climate change is “Business as Usual”, even though you may have to move to higher ground or away from an encroaching desert.
LikeLike
“My adaptation plans include more water storage and a roomier underground cellar. The idea is to invest now and save on water and power bills later.”
Mine is to agitate for nuclear power on the grounds that it’s the only power source capable of ensuring food and water are likely to be available.
LikeLike
“The need for action is urgent and our window of opportunity for avoiding severe impacts is rapidly closing”
No it isn’t. What we need is a credible nuclear electricity and gradual adaptation to changing climate, where required, as galloping camel says. Nothing more than that. Unless your job depends on maintaining a false sense of panic, that is.
LikeLike
I stumbled on this book. (Free on-line):
The Nuclear Energy Option: An Alternative for the 90’s by Bernard L. Cohen
Others here may have already read it, but I thought it was interesting to look at a perspective from 20 years ago. It has a chapter on environment and climate change as major drivers for the wide scale adoption of nuclear power. The discussion of climate change could have been written today. The whole book is very good.
It is remarkable (and very sad) that things have hardly changed at all.
LikeLike
“…It is remarkable (and very sad) that things have hardly changed at all.”
…including the climate.
LikeLike
I challenge those who think we will adapt easily to go through a day of 50C temperatures (122F) without air conditioning.
After all they might have to
http://www.etsa.com.au/centric/our_network/demand_management.jsp
LikeLike
The point about demand management seems particularly pertinent in view of the fact that nine nations have recorded their highest temperatures this year
http://www.wunderground.com/blog/JeffMasters/comment.html?entrynum=1546
Whatever energy savings may or may not be achieved by demand management, it seems perfectly clear that as temperatures rise and there are more frequent and larger magnitude heat waves the demand for peak capacity can only rise.
LikeLike
quokka, on 22 July 2010 at 10.05 — Only where people can afford air conditioning.
LikeLike
barry:
I don’t know if it would be worth traveling to anthony watts’ contrarian site and analyzing their automatic rebuttals to anything put out by NOAA, viewed as a socialist website by most of the folks there.
They of course have labeled the recent NOAA claims to be a hoax based on false or missing data–propaganda not science.
More precisely, Watt claims that where the greatest upward temp anomalies are found, the least data is available. Greatest anomalies point to absence of weather stations.
They focus on Africa and Greenland. It should be noted that even with their own graphs, many of the hot spots in Africa point directly at a weather station, but even when a hot spot does not correlate directly with a weather station, how close does a weather station have to be to a region to take a viable reading?
Given the number of “skeptics” out there, and given that you are after all a climate scientist, is it worth responding to anthony watt?
I gather you think responding to contrarians is at this point fruitless and so you post NOAA data, assuming it will be taken as valuable by most people.
question: are the contrarians more beyond the pale than anti nuke renewables types? the latter BNC really confronts. The former, no longer.
I understand non confrontation with contrarians is the “pragmatic” move to make when the contrarians are pro nuclear power.
I worry that this pragmatism could come back to bite the majority of pro nuke people; after all, what if only or primarily state led forces can build these things fast enough and safely enough given the current investment climate? some of our pro nuke folks will then oppose nukes, since what they hate the most is “big government.”
LikeLike
That the Earth is warming is a fact. It has gone through many cycles in it’s lifetime. The role oman is minor ie cutting of forests etc. There is NO PROOF of carbon playing any role. East Anglia has played a very bad role in hiding info and fudging results. There computer program does not yield repeatable results by others. This is the singular most important tool for science. If we wish to prepare and/or mitigate global warming it would be best to eliminate strawmen like carbon and examine events more closely so we eventually may succeed in doing something of use.
Len
LikeLike
so all those graphs produced by climate scientists showing that natural variation does not account for the observed warming trends are frauds.
okay.
btw, skeptics celebrate data from NOAA if it fits their preconceptions (see if they were skeptical about 2008 climate data–a RELATIVELY cooler year); they view it as a socialist conspiracy when it does not (last two years).
LikeLike
Len – do you think that you making a claim repeatedly will make such claim more valid? In particular if such claim contradicts the available scientific evidence?
http://www.skepticalscience.com/empirical-evidence-for-co2-enhanced-greenhouse-effect.htm
LikeLike
Barry
Above: Sacr
eamento CA,LikeLike
@greg meyerson
On the issue of the proximity of weather stations, it should be noted that it’s not absolute temperature that is important, it is temperature anomaly. As I understand it, it has been shown that anomalies extend over significant geographical areas and something like 1200kms is some sort of rule of thumb. (eg if it is hot in London it is very likely hot in Paris as well) When there is more than one station, I think there is a weighting applied according to distance in the griding. This has been discussed more than once over at RealClimate.
I’m pretty sure all of this is well documented on the GISS web site and in papers by Hansen and others describing the compilation of the temperature record. No doubt NOAA also have similar publications.
LikeLike
thanks quokka:
I figured the answer was something like you say: which of course makes the watt point a total absurdity, if not a self evident absurdity.
the contrarians, the smarter ones, are great at peddling absurdities that are not absurd on their face, and so require some knowledge that most of us don’t have.
Gross, gross, gross.
thanks again and I get the point about temp anomaly.
LikeLike
A heads up for those who may of missed it: NOAA (US National Oceanic and Atmospheric Administration) has released it’s 2009 State of the Climate report
The big message is that multiple lines of evidence (not just surface temperature) all show with a confidence beyond reasonable doubt that the planet is warming:
Based on comprehensive data from multiple sources, the report defines 10 measurable planet-wide features used to gauge global temperature changes. The relative movement of each of these indicators proves consistent with a warming world. Seven indicators are rising: air temperature over land, sea-surface temperature, air temperature over oceans, sea level, ocean heat, humidity and tropospheric temperature in the “active-weather” layer of the atmosphere closest to the Earth’s surface. Three indicators are declining: Arctic sea ice, glaciers and spring snow cover in the Northern hemisphere.
LikeLike
The Independent reports The dead sea: Global warming blamed for 40 per cent decline in the ocean’s phytoplankton
If further studies support this finding, this has to be more than a little worrying – disastrous might be a better phrase. And an indication that carbon cycle feedbacks may not be as long term as we might have hoped for. The free ride on the biosphere’s ability to absorb CO2 may be being lost a lot faster than previously thought. Scary stuff.
LikeLike
this raises a question I’d like to understand much better.
there is the decline of phytoplankton on the one hand (this is the weakening of the “biological pump?”); then there is the build up of different algae leading to dead zones (a process connected to nitrate run off in gulf, etc).
Barry or anyone: can you recommend a book on the oceans, specifically how “algaes” of various kinds react to warming, in such a way as to sort out the “killing algae” phenomenon (leading to oxygen depletion and weakening of carbon sink) from the spread of algae leading to oxygen depletion (cyanobacteria?)
Looking for understanding here.
LikeLike
I can’t believe that anyone can believe global warming exists.Scientists predicted LESS rainfall across the eastern seaboard of Australia & Australia’s had record above average rainfall.The climate will always change & go through cycles.Cyclones,hurricanes,droughts,floods,hot,cold,mild,windy etc etc etc.1st it was global warming,2nd it was climate change & now 3rd is the earth will experience extremes in weather.Tell me when the earth had a stable climate????
LikeLike
Peter, on 11 January 2011 at 1:16 AM — The climate was relatively stable for the past 10,000 years, but isn’t anymore.
LikeLike
“I can’t believe that anyone can believe global warming exists”
“The climate will always change”
Contradiction anyone? ;)
LikeLike
//// “The term “global warming” says it all – a heating of the atmosphere right across the world.” ////
This term implies it, indeed, and some people believe it, but per definition “global warming” is a rise in the “average temperature”.
The only thing you can conclude from an average rise is, that there is a rise at least at 1 place. By no means you can conclude anything about “across the world”.
So, actually it is wrong to call “global warming” “global warming”. The right term would be “average warming”, but this term would have no propaganda effect.
That’s why “global warming” can not produce e.g. ice melting in Greenland. You may have an “average warming” and at the same time “cooling” in Greenland. Or the other way round: “average cooling” and at the same ice melting in Greenland.
The same goes for other “consequences” of “global warming”.
LikeLike
Greg House, on 10 June 2011 at 8:41 AM — Well, some places warm at different rates than ohter places but the atmosphere is well-mixed on a 2+ year time scale. So the warming happens everywhere, more or less, with greater warming in the Artic than at the equator.
LikeLike
@David B. Benson
Look, our air is constantly moving and changing its temperature. Physically the same molecules move and change their temperature, but the weather stations do not travel around the world, they measure the temperature at certain places.
So statistically you may have different trends on different places for whatever reason. The AGW proponents put all the data together, calculate an average and see a “global warming”, that is not “global” per definition and is purely statistical.
It might well be, that e.g. only 20% of the weather stations show “warming”, 30% show “cooling” and 50% show neither “warming” nor “cooling”, but the “warming” at some places is a little bit stronger, than “cooling” at other places, so you get a rise in average.
My point is, that a rise in average does not mean a rise everywhere.
Geographically you might well have a rise only in rather small areas. Anyway, you can not conclude, that there is a rise in a certain area just because there is a rise in “global average”.
That goes for Greenland, Arctic, Antarctic, agriculture, diseases, populations of animals and all the consequences too. You may have an average rise in average temperature and at the same time more ice, less diseases, more animals, more agriculture production etc.
MODERATOR
As a newcomer to BNC you may not be aware that unsubstantiated personal opinion on scientific matters is likely to be deleted. To avoid this in future, please supply refs/links to support your arguments.
LikeLike
(Comment deleted – violation of the citation policy.)
LikeLike
While Greg House 10 June 2011 has an interesting opinion, the role of climate science is to place data at the hands of those who want to understand what is going on in our climate.
A good place to start is http://www.columbia.edu/~jeh1/ it’s the blog site for Dr James Hansen. I’ve been reading his material for some years and often think he has made a mistake or hope he has.
To date all the things that I thought he had wrong or could not be so I took the trouble to look for and find other references that corroborated Dr Hansen’s work.
He has been correct in all of the issues that I thought he had got wrong. Moral of the story – philosophy and climate science don’t mix. When checking a climate issue data trumps guesses.
LikeLike