 This is the fourth and final part of the series of extracts from the book Plentiful Energy — The story of the Integral Fast Reactor by Chuck Till and Yoon Chang.
Reproduced with permission of the authors, these sections describe and justify some of the key design choices that went into the making the IFR a different — and highly successful — approach to fast neutron reactor technology and its associated fuel recycling.
These excerpts not only provide a fascinating insight into a truly sustainable form nuclear power; they also provide excellent reference material for refuting many of the spurious claims on the internet about IFR by people who don’t understand (or choose to wilfully misrepresent) this critically important technology.
For reference, here are the previous entries:
Part 1 (metal fuels and plutonium).
Part 2 (coolant choice and reactor configuration).
Part 3 (lessons learned from fast reactor capital costs).
This last extract considers the cost differences and similarities between the next-generation IFR and the current generation of thermal reactors (using a comparison with a generic LWR). Note that this section does not include the costs of fuel (mining, enrichment, fabrication, recycling, and so on). That is, however covered later in the book:, with full fuel-cycle cost estimate being: LWR = 0.55 c/kWh at current uranium cost (Table 13-4) and IFR 0.44 c/kWh — or $35 million/GWyr (Table 13-9).
This section is drawn from pages 277-280 of Plentiful Energy. To buy the book ($18 US) and get the full story, go to Amazon or CreateSpace. (Note that the images below do not come from the book).
—————-
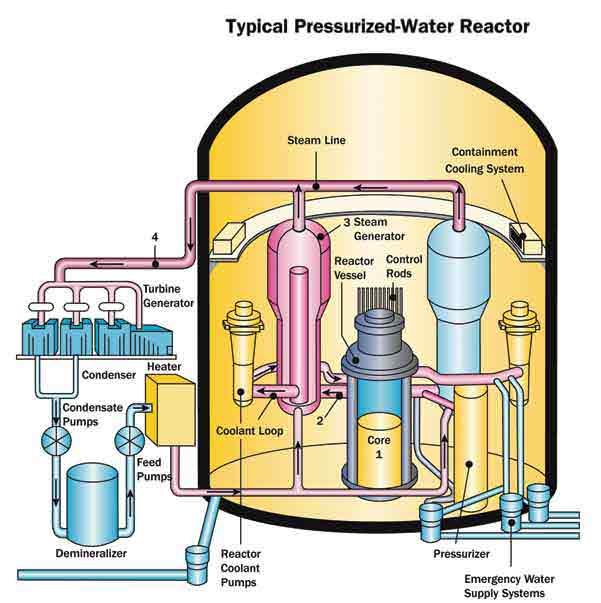
Generic cost comparison between the IFR and LWR (light water reactor)
Comparison of fast reactor capital cost with the capital cost of commercial LWRs is not straightforward either. First, the part that should be straightforward, that of identifying the capital cost of commercial reactors, isn’t straightforward at all. U.S. LWRs were built twenty or more years ago, under wildly varying construction environments, some prior to the anti-nuclear campaigns of cost increases, some during the height of them, and a few after. Comparisons between PWR, BWR, heavy water reactors, and gas-cooled reactors are not straightforward either, even though, with the water reactor types, we are dealing with actual experience. Comparison with yet-to-be-designed fast reactors involves more uncertainty. However, the details of the makeup of capital costs do provide useful insight.
The Department of Energy’s Energy Economics Data Base (EEDB) defines a code of accounts for estimating and categorizing such cost components. [6] For illustrative purposes, a reference PWR capital cost breakdown developed for the EEDB is presented in Table 13-2. [7] Since the database was generated in the 1980s, the absolute dollar amounts have little relevance to today, so the cost breakdown is expressed in terms of percentage of the total direct costs.
