SA Nuclear Fuel Cycle Royal Commission – update

Today the Expert Advisory Committee of the South Australian Royal Commission into the Nuclear Fuel Cycle was announced. The members include Dr Tim Stone (University College London, KPMG), Prof Ian Lowe (my co-author Why vs Why: Nuclear Power), Dr Leanna Read (Chief Scientist of SA), Mr John Carlson (formerly of ASNO), and me (Barry Brook). I look forward to engaging in a productive, evidence-based process with my colleagues.

The first Issues Papers has also been released today Exploration, Extraction and Milling. Further papers will be released in the coming weeks, and then there will be 90 days open for submissions. The RC will report to the SA Government within just over a year: by May 2016.

Is Renewable Energy looking like a ‘new religion’?

Guest Post by Martin Nicholson. Martin studied mathematics, engineering and electrical sciences at Cambridge University in the UK and graduated with a Masters degree in 1974. He published a peer-reviewed book on low-carbon energy systems in 2012The Power Makers’ Challenge: and the need for Fission Energy


Firstly, what does renewable energy (RE) actually mean? Wikipedia says renewable energy refers to the provision of energy via renewable resources which are naturally replenished as fast as being used. RE resources include sunlight, wind, biomass, rain, tides, waves and geothermal heat.

In “The myth of renewable energy” (Dawn Stover, published in the Bulletin of the Atomic Scientists), Stover believes that “renewable energy” is a meaningless term with no established standards.

RE certainly needs to deliver energy that we can readily use – more than just the RE resources (sunlight, wind, etc.). These RE resources have to be converted into usable energy.  We need wind turbines, solar panels, farming equipment and generators for biomass, and water catchment and generators for hydro sources. Alas wind turbines and solar panels do not grow on trees.

Renewable energy converters require the use of steel, copper, concrete and rare earth elements plus all the land on which to build these converters. Wind farms and large scale solar plants require transmission lines to connect to the electricity grid. The materials used to make the energy converters and transmission lines are not naturally replenished so Stover is probably correct when she says “renewable energy” is a meaningless term. But let’s stick with the term for now because it is in the common vernacular.

But is RE looking like a ‘new religion’?

Continue reading

Tunnel Vision at the Climate Council

GR_April2015_CCCGuest Post by Geoff Russell. Geoff recently released the popular book “Greenjacked! The derailing of environmental action on climate change“.


The Climate Council has a new report out. The Global Renewable Energy Boom: How Australia is missing out (GREB) is authored by Andrew Stock, Tim Flannery and Petra Stock. The lead author is listed on the Climate Council website as a “Non Executive Director of several ASX listed and unlisted companies in the energy sector, ranging from traditional energy suppliers to emerging energy technology companies.” He’s also a chemical engineer.

Page 6 of the report begins by claiming “Globally, renewable energy’s contribution to global capacity and generation has climbed steadily upwards (Table 1)”.

Here’s line 4 from Table 1 except that I’ve added a column in red for 1973 using data from the IEA:

The percentage isn’t so clearly “climbing steadily upwards” now is it?

This table is one of a number carefully chosen or designed to enhance the images of wind and solar power and to misleadingly exaggerate their ability to prevent further destabilisation of the climate.

Misusing words

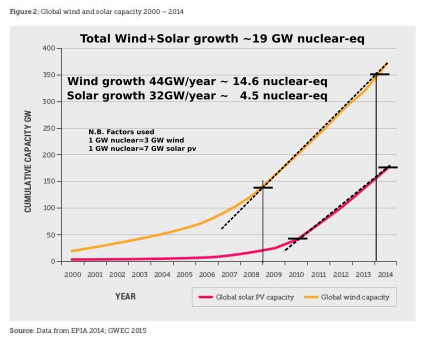
Page 8 follows with a claim in a large red font: “Global wind and solar capacity is growing exponentially”. This is accompanied by a graph which I’ve repeated here; but with a few annotations … in black. I’ll discuss them later.

Who think the graph supports the claim? It doesn’t. Exponential growth, by definition is growth with a regular doubling time, not regular increments … big difference! Growing exponentially is pretty easy for something trivially small, but it soon becomes hard and the graph shows clearly that both wind and solar are now only growing linearly; after about 2010 for solar PV and 2008 for wind.

The lead author is an engineer, so why call something exponential growth when it isn’t?

As the wind and solar contributions to an electricity grid grow, engineers expect stability problems to which there are currently no answers. AEMO’s 2013 report into 100% renewable electricty in Australia recommended underpinning wind and solar with either a biomass or geothermal baseload system to reduce the volatility; the sudden swings in supply. Germany obviously understands this and is now just burning half her forestry output annually. That’s about 30 million tonnes. This provides more electricity than either wind or solar.

Germany certainly had exponential growth in both wind and solar for some years, but that’s long gone. It took just one year to double the PV output for 2005; but the output from 2011 still hadn’t been doubled by the end of 2014. This slow down is despite solar providing just 6 percent of electricity. The wind power growth slowdown is even more advanced; it took eight years to double the 2004 wind output. Closer to home, South Australia has a higher renewable penetration than Germany, but no biomass baseload component, hence the stability risks which I suspect are behind the back-flip by long time nuclear opponent Jay Weatherill with the establishment of a Royal Commission into (almost) all things nuclear.

Understanding renewable growth

But am I being too cynical? The wind and solar growth lines above still look impressively steep. How can that be when Table 1, in contrast, shows a negligible percentage growth between 1973 and the present?

Continue reading

International Experience with Fast Reactor Operation & Testing

Below is a highly informative presentation given by Dr John Sackett (Idaho National Laboratory, Retired) at the International Conference on Fast Reactors and Related Fuel Cycles (Paris, 2013). John, with a 34-year career in advanced reactor and fuel-cycle development (including work on the Integral Fast Reactor from 1984-1994), provides a clear summary of historical-international experience with fast reactor programmes and initiatives to recycle used fuel.

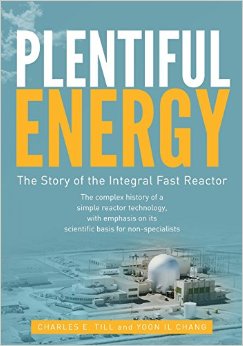
This is important information for advocates of ‘Generation IV’ nuclear technologies to understand, because the question of “is it proven to work?” is often asked by the skeptical. Much of this will be familiar to those who have read “Plentiful Energy“, but this is an excellent condensed version of that material. This is also highly relevant in the context of the recently commenced Nuclear Fuel Cycle Royal Commission.

There is a Long History of Fast Reactor Operation
• The first reactor in the world to produce electricity was a fast reactor, the Experimental Breeder Reactor I in December of 1951.
• International experience with fast reactor technology exists in the US, Russia, France, Japan, UK, Germany and India.
• The operating experience with these reactors has been mixed: early problems were associated with fuel cladding, steam generators, fuel handling, and sodium leakage.
• Excellent experience has been gained, however, that demonstrates the robust nature of the technology, the potential for exceedingly safe designs, ease of maintenance, ease of operation and the ability to effectively manage waste from spent fuel.
• It is a mature technology.

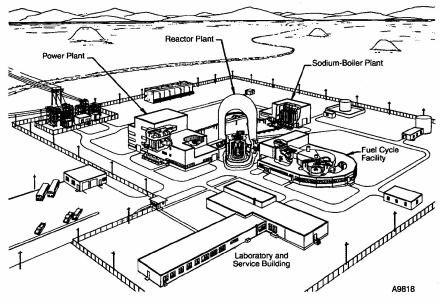
EBR-II was a Major Contributor to the Technology
• EBR-I was followed by EBR-II, which was a complete power plant. It was extremely successful, operating for 30 years and advancing the technology in many ways.
• Principal among its contributions were development of metal and oxide fast-reactor fuel, operational-safety tests which demonstrated the self-protecting nature of fast reactors, and fuel-recycle technology that was efficient and secure.
• Perhaps the most important advance in safety was the demonstration of the self -protecting response of sodium-cooled fast reactors in the event of Anticipated Transients without Scram.
• Tests of Loss of Flow without Scram and Loss-of –Heat-Sink without Scram were conducted at EBR-II from full power with no resulting damage to fuel or systems, ushering in worldwide interest in passively safe reactor design.

International Experience Compliments These Examples
• This experience base is fully supported by a combination of small test reactors that explored all aspects of the technology and larger operating reactors that provided power to the electric grid.
• Small experimental reactors were operated in the US (EBR-II), France (Rapsodie), Russia (BOR-60), Japan (JOYO), UK (DFR), Germany (KNK-II), and India (FBTR).
• Power reactors and larger experimental reactors were operated in the US (FERMI1, FFTF), France (Phenix, Superphenix), Russia (BN350, BN600), Japan (Monju). Current operating Fast Reactors are China (CEFR), and Russia (BN600, BOR60)
EBR-II_SiteUS Experience Followed Two Paths
• The US carried forward two separate tracks of technology development, primarily associated with the choice of fuel, metal or oxide.
• The first US commercial fast reactor, Fermi-I utilized metal fuel while the Fast-Flux-Test-Facility (FFTF) and the Clinch River Breeder Reactor (CRBR) utilized oxide fuel.
• Due to perceived low burnup potential for metal fuel, (a problem later solved), the U.S. approach turned to oxide fuel in the late 1960s.
• Russia, France, Germany and Japan all follow technology paths that use oxide fuel.
• It is worthwhile expanding this point because diversion of the technology paths has resulted in very different designs and performance, with the result that EBR-II is somewhat unique in this family of reactors.

Dry Reprocessing of EBR-II Fuel was Demonstrated in the 1960s
• Melt Refining was used to recycle fuel for EBR-II from 1964 through 1969
– More than 700 EBR-II fuel assemblies recycled using melt refining and returned to the reactor in four to six weeks
– ~34,000 fuel pins successfully reprocessed, including remote fabrication by injection casting
– Spent fuel was disassembled, chopped, placed into a Zr2O crucible, and heated to 1400 C
– Chemically reactive fission products reacted with the crucible to form oxides
– Uranium and noble metals remained in the metallic state and stayed with the melt to be returned with the re-cast fuel pins
– The fuel was fabricated remotely by injection casting, the resulting equilibrium fuel composition, called fissium, operated through the life of EBR-II. Continue reading

Reducing emissions: Goldberg machines are not meant to be planning advice

Guest Post by Alex Coram. Alex is Professor (Emeritus) at the University of Western Australia and a visiting professor at Robert Gordon University and the University of Massachusetts. He mostly works on problems in mathematical political-economy.


Rube Goldberg machines are devices for achieving some straightforward objective in a manner that requires great expenditure of effort and resources and is so fanciful and complicated that there is little chance of succeeding. Their appeal results from the fact that they are the consequence of ignoring simpler ways of achieving the same result. They also demonstrate the mathematical point that an unconstrained solution is better than a constrained solution. They are about the last thing we should think about when faced with a serious problem.

Right now we are faced with such a problem. The Intergovernmental Panel on Climate Change says that to reduce the possibility we will push the climate to a new trajectory anthropogenic emissions of greenhouse gases need to be cut by between 50 and 80 percent on current figures by about 2050. They need to go to zero sometime after that. If this is not achieved temperature increases may vary from manageable to possibly over 4 degrees centigrade. In the latter case the result would be large scale species extinction and possible economic collapse. This is about as bad as it gets, short of maybe an asteroid strike or something similar.

No solution to these problems is simple, of course. However, some are beginning to look a bit like Rube’s machines. To see the point consider the following stripped down view of the options.

Plan A. Follow Clausewitz’s dictum ‘in war moderation is madness’ and throw everything we have at it. This means solar, wind, bio-fuels, nuclear the lot. Since hydro is difficult to expand I leave it to one side for this discussion.

Plan B. Exclude nuclear and just use solar, wind and bio-fuels.

As soon as we try for plan B we complicate things by excluding the main potential source of low emissions expandable base load energy.

Suppose we try to get all the energy we need using solar voltaic. First we need land. There are a lot of maps on the internet that give the total land required as reassuringly small dots that add up to about the size of Texas. A better way to do it is to scale up solar installations like the Topaz plant in California. From this we need about 200~km^2 for each average size 1 GWe power station we replace. Imagine, for example, that the population of India uses about half current US energy per person. In this case it would be necessary to cover between 10-20 percent of India’s land mass with panels.

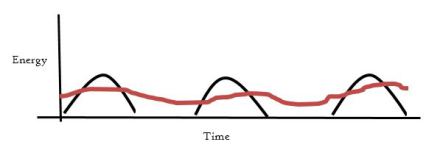
To get an idea of the nature of the second problem just draw a horizontal line that represents a few days and draw average energy requirements as a line that goes up and down a bit. Now draw some humps of about six hours wide once every twenty four hours.

What is apparent is that the gaps are bigger than the energy filled in bits. And some of the energy is wasted because it is at the wrong time. Depending what you want to assume about back up, there are periods where we may have to fill in by100 percent.

So let’s add wind to the diagram. Just draw a line that spikes up and down between the maximum and zero in a random fashion.

Is wind totally random? As far as getting it to correlate with gaps in the sun, near enough. There is no reason why the wind should coincide with our sunshine humps. Sometimes it adds to surplus when we don’t want it. Sometimes it adds nothing when we do want it.

Continue reading