 Download the printable 33-page PDF (includes two appendices, on scenario assumptions and transmission cost estimates) HERE.
For an Excel workbook that includes all calculations (and can be used for sensitivity analysis), click HERE.
By Peter Lang. Peter is a retired geologist and engineer with 40 years experience on a wide range of energy projects throughout the world, including managing energy R&D and providing policy advice for government and opposition. His experience includes: hydro, geothermal, nuclear, coal, oil, and gas plants and a wide range of energy end use management projects.
Summary
Here I review the paper “Simulations of Scenarios with 100% Renewable Electricity in the Australian National Electricity Market” by Elliston et al. (2011a) (henceforth EDM-2011). That paper does not analyse costs, so I have also made a crude estimate of the cost of the scenario simulated and three variants of it.
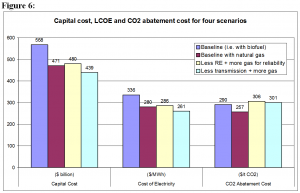
For the EDM-2011 baseline simulation, and using costs derived for the Federal Department of Resources, Energy and Tourism (DRET, 2011b), the costs are estimated to be: $568 billion capital cost, $336/MWh cost of electricity and $290/tonne CO2 abatement cost.
That is, the wholesale cost of electricity for the simulated system would be seven times more than now, with an abatement cost that is 13 times the starting price of the Australian carbon tax and 30 times the European carbon price. (This cost of electricity does not include costs for the existing electricity network).
Although it ignores costings, the EDM-2011 study is a useful contribution. It demonstrates that, even with highly optimistic assumptions, renewable energy cannot realistically provide 100% ofAustralia’s electricity generation. Their scenario does not have sufficient capacity to meet peak winter demand, has no capacity reserve and is dependent on a technology – ‘gas turbines running on biofuels’ – that exist only at small scale and at high cost.
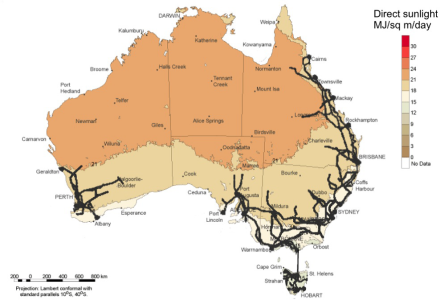
Map of Australia’s transmission lines. There are no transmissions lines to any of the proposed CSP sites, and the best solar areas are far removed from the existing transmissions infrastructure.Source: Grattan Institute, Figure 10.1 (attributed to DRET (2010), Grattan Institute)
Introduction
I have reviewed and critiqued the paper “Simulations of Scenarios with 100% Renewable Electricity in the Australian National Electricity Market” by Elliston et al. (2011a) (henceforth EDM-2011).
This paper comments on the key assumptions in the EDM-2011 study. It then goes beyond that work to estimate the cost for the baseline scenario and three variants of it and compares these four scenarios on the basis of CO2 emissions intensity, capital cost, cost of electricity and CO2 abatement cost.
Comments on the EDM-2011 study
The objective of the desktop study by EDM-2011 was to investigate whether renewable energy generation alone could meet the year 2010 electricity demand of the National Electricity Market (NEM). Costs were not considered. The study used computer simulation to match estimated energy generation by various renewable sources to the known hourly average demand in 2010. This simulation, referred to here as the “baseline simulation” proposed a system comprising:
- 15.6 GW (nameplate generation capacity) of parabolic trough concentrating solar thermal (CST) plants with 15 hours thermal storage, located at six remote sites far from the major demand centres;
- 23.2 GW of wind farms at the existingNEMwind farm locations – scaled up in capacity from 1.5 GW existing in 2010;
- 14.6 GW of roof-top solar photovoltaic (PV) inBrisbane,Sydney,Canberra,MelbourneandAdelaide;
- 7.1 GW of existing hydro and pumped hydro;
- 24 GW of gas turbines running on biofuels;
- A transmission system where “power can flow unconstrained from any generation site to any demand site” – this theoretical construct is termed a “copperplate” transmission system.
The accompanying slide presentation by Elliston et al. (2011b), particularly slides 5 to 12, provides a succinct summary of the objective, scope for their simulation study, the exclusions from the scope, the assumptions and the results.
The results of the baseline simulation show that there are six hours during the year 2010 when demand is not met, with a maximum power supply shortfall of 1.33 GW. It should be noted that the supply shortfall would be significantly greater with higher time resolutions, e.g. 5 minute data rather than the 1 hour increments used, but this limitation is not addressed by EDM-2011.
The EDM-2011 approach is more realistic than Beyond Zero Emissions (2010) “Zero Carbon Australia – Stationary Energy Plan” (critiqued by Nicholson and Lang (2010), Diesendorf (2010), Trainer (2010) and others), especially because EDM-2011’s approach, as they say, “is limited to the electricity sector in a recent year, providing a more straight forward basis for exploring this question of matching variable renewable energy sources to demand.” As the authors say, “this approach minimises the number of working assumptions”.
Continue reading →
 Graham Palmer, a regular BNC community member, has published a new book. It is titled “Energy in Australia: Peak Oil, Solar Power, and Asia’s Economic Growth” and is published by Springer (in their “Springer Briefs in Energy” series). It’s a slim, taughtly written volume (91 pages) that can be read in 1 or 2 sittings. If you have a Kindle, you can purchase it on Amazon.com.au.