


.png)
 I was asked by the Adelaide Advertiser newspaper to write a short piece last week which addressed the question “Does all the recent rain across the country prove man made climate change is real?“, in less than 500 words. My response, given below, appeared in the print edition on Thursday 9 September 2010:
————————————
Does all the recent rain across the country prove man made climate change is real? No.
As Dorothea Mackellar wrote over a century ago, Australia is naturally “A land… Of droughts and flooding rains”.
Putting the impossible issue of ‘proof’ aside, scientists certainly do expect climate change to lead to an increase the frequency and intensity of extreme weather events. After all, a warmer planet holds extra energy, making today’s climate system more dynamic than when Mackellar penned her poem.
In short, as the Earth’s atmosphere traps more heat due to an increase in greenhouse gases, it triggers more evaporation of water from the oceans. Average global humidity and precipitation rise in response.
As such, climate scientists predict increasingly energetic storms, heavier bursts of rain, and more intense flooding. In many parts of the world, deeper droughts and longer, hotter heat waves are also forecast.
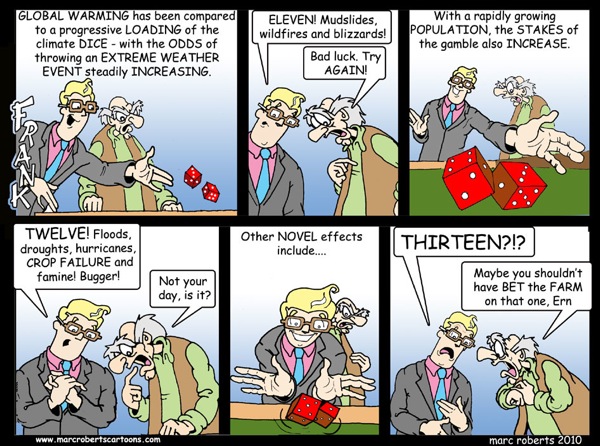
So, while it is impossible to attribute any one event solely to human-caused warming, a useful analogy is that “weather throws the punches, but climate trains the boxer”. Another way to look at it is that human impacts are “loading the climate dice” towards more unfavourable (and previously unlikely) outcomes.
 We have probably witnessed this in the unprecedented heat wave in Russia and record floods in Pakistan. These impacts cause great human misery and severe economic and environmental damage.
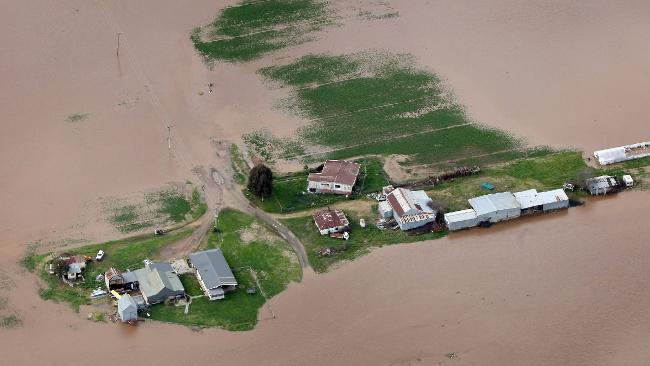
Earlier this year in Australia, the Bureau of Meteorology released a Special Climate Statement on the recent exceptional rain and flooding events in central Australia and Queensland. February 28th 2010 was the wettest day on record for the Northern Territory, and March 2nd set a new record for Queensland. Over the 10-day period ending March 3rd, an estimated 403 cubic kilometres (403,000 gigalitres) of rainfall fell across the NT and QLD. Extreme, indeed.
It’s clear that if such ‘unusual’ climatic events are visited upon us ever more regularly, then there will be practical limits to adaptation, or at least exponentially rising costs involved in coping.
The need for action on eliminating our dependence on fossil fuels is urgent and our window of opportunity for avoiding severe impacts of climate change is rapidly closing. Yet the obstacles to change are not principally technical or economic, they are political and social. But that’s another story…


Filed under: Clim Ch Q&A, Impacts


Is there any evidence that we are seeing hotter heatwaves, deeper droughts, more extreme weather events, heavier rainfall, and higher humidity?
The fact that extremes are occurring in other remote areas are clearly evidence of warming but to get to the evidence that it’s man-made is important because it will help us realize that we can reverse this trend. I’m sure that 500 words is far too short to establish any kind of proof.
I would like to see some graphs in such an article that shows what would be expected based on projections.
I am also interested in knowing about indirect influences besides global warming such as how pollution affects the ozone and whether water pollution affects weather.
I like the boxer/trainer allusion in this sensible little article.We can only hope that it wakes a few more of the sleepers.
thorium,I don’t see any reversal of the trend even in the best case scenario.By polluting our ocean of air and water we have locked in major changes in climate,probably for thousands of years.
However,IF we can cease polluting in the very near future we will slow the trend,hopefully to a stop.
The most serious effect on the oceans from increased carbon dioxide is acidification.This will probably cause so many problems for marine life that any effect on the weather will not be in the race.But changes in ocean currents as a result of warming will no doubt affect climate and weather.
There are plenty of projections and graphs around which show the likely way we are headed. Most of these are conservative and some from a few years back have already been proved to be too optimistic.
We are bound for uncharted and dangerous waters.It is about time we stopped engines and considered our situation prepartory to setting a new course.
I think it’s odd that winter didn’t really arrive in SE Australia til mid August the same time the Russian heat wave abated. The problem seems to be not so much the 0.2C per decade trend but the extremes. Russia was thought to benefit from gradual warming. I guess they didn’t think about peat swamps spontaneously catching fire. We can expect bread prices to rise because of anomalous heat in both Russia and our local wheat bowl WA.
Clearly we need to quantify and put a cost estimate on excess weather damage above normal variation. That includes costs of storms, abnormal fires, heatwaves, summer frosts, coastal erosion, large hailstones and so on. Bob Brown likes to point out that Australia’s coal exports make $25bn but an irreversible coral bleaching event could annihilate the $60bn reef tourism industry.
This post popped up just as I had begun assembling the evidence of extreme weather events in 2010 that have effected Tennessee. East Tennessee has endured its hottest summer -June to August – ever, with average summer temperatures that were one consistently degree higher that have ever before recorded. While Middle and West Tennessee experienced a thousand year rain event which lead to numerous rivers having record flood crests in marly May.
http://www.srh.noaa.gov/news/display_cmsstory.php?wfo=ohx&storyid=51928&source=0
http://www.srh.noaa.gov/news/display_cmsstory.php?wfo=ohx&storyid=51806&source=0
On May 1 and 2 Nashville experienced 13.53″ of rain breaking its all time previous two day record of 6.68″ by 6.85″.
The wide spread rain event in central and southern Kentucky, Middle and West Tennessee and Northern Mississippi produced a number of 1000 year flood crests including the crest of the Cumberland River in Nashville.
Videos of Nashville thousand year flood.
John McEvoy, yes, there is. You can start by clicking on the links I provided and follow your nose from there. There is plenty of material, if you are interested.
Rick, ozone depletion does not have a marked effect on climate, although it does impact on Antarctic circulation which can have cascading effects. The work on attribution and ‘fingerprinting’ is a major body of work, led by folks like Ben Santer. You might wish to start here: http://www.ipcc.ch/publications_and_data/ar4/wg1/en/ch1s1-3-3.html
John McEvoy, There is a very nice chart showing the relationship between specific (ie absolute) humidity and temperature presented in this post:
http://tamino.wordpress.com/2010/08/08/urban-wet-island/
It’s the second chart.
I was looking for reasons to disagree with Barry on the hypothesis that a warmer climate can cause more flooding. However, he has to be right when he says that warmer temperatures cause more humidity and therefore more water in the atmosphere. What goes up must come down so a higher rate of evaporation has to lead to higher average precipitation and hence more flooding.
Barry mentioned a paper by (recently deceased) Stephen Schneider and others which is an example of climate alarmism taken to the point of absurdity:
http://www.pnas.org/content/106/11/4133.full
As the climate warms from present levels, temperatures at the poles are likely to rise by three to five times the rise at the equator, One consequence of this is a reduction in the temperature differential between the low and high latitudes, Lower temperature differentials imply LESS violent storms.
Warmer oceans in tropical latitudes will deliver more rainfall but that does not necessarily imply more violent storms everywhere.
Have you all noticed where our winter rain is coming from? Some has come from the usual fronts but most of it has drifted in from the North west off the Indian ocean. And the map today shows another belt of rain coming in from that NW direction. My understanding of rainfall systems in Australia would suggest that the “Summer monsoon” which runs from November to April generally has continued throughout the year. I’m not sure if this is a first but perhaps there’s a “weather man” who could enlighten me. I did read something about La Nina recently that may be a contributing factor but it is all a bit unusual I must say. As I said in a previous post, Lake Eyre in the past has been a lot bigger and full of fresh water. Must have been a time of a much more humid climate then. Maybe at this stage of a Pleistocene interglacial things are naturally returning to one of those warmer more humid times. Then again, it might also be that we’ve caused the warming with all of our environmental vandalism. I’m not sure what to believe but still find it hard to accept that we’re the problem. Oh well, I’ll keep trying. By the way, I’ve just posted a letter to Combet suggesting that he try to get nuclear power accepted by the ALP. He’s keen to protect coal mining and that’s fine but I’ve said mine it but DON’T burn the stuff for electricity. Use it for other things etc. I’ll be interested to see if he replies to my letter.
Imagine the destruction ,deaths, dislocation and disease following the Feb 2010 downpours in the NT and QLD – IF the population living in outback Australia numbered the same as in Pakistan.
I’m sure that 500 words is far too short to establish any kind of proof.
Only one word is required to answer this question
Do the recent floods prove man-made climate change is real?
And that word is No.
To even imply otherwise would do this excellent website (due to the quality of information on nuclear energy) a disservice.
Hi RJ. Indeed. As you’ll note, my first, one-word sentence response at the top of that article was exactly that: No.
http://davidappell.blogspot.com/2010/09/does-atmospheric-blocking-explain.html
Notwithstanding Brook’s boxer-punches analogy, Kevin Trenberth (179 publications, 13,500 citations, h index 58; head of climate analysis at NCAR) appears to make a direct AGW causal attribution dated 2 September in the case of the Russia heatwave: see above link.
Peter Lalor: thanks for that reference. Here is what Trenberth says:
NASA attributed the heat wave to “the blocking pattern,” but Trenberth EXPLAINS the persistence of the blocking pattern.
The “stalled jet stream” or really the so-called blocking pattern is merely a description of the atmospheric state or phenomenon, not a cause. The question is why is it like that? For that we seek to find systematic influences (what we call forcings) on the atmosphere that tends to lock it into one state. The main sources of such forcings are the mountains, land vs ocean, and the heating of the atmosphere. Only the latter changes. With El Nino or La Nina, the changes in sea surface temperatures change the areas where convection, thunderstorms, tropical storms etc, occur systematically. The heavy rains in those phenomena produce large heating of the atmosphere through the latent heat release: the release of the heat that went into evaporating the moisture in the first place is given up when the moisture condenses. It is that heating pattern that sets up unusual wave patterns and teleconnections in the atmosphere. It acts a bit like a rock in a stream of atmospheric air, with ripples up and downstream. In the case of the very active monsoon, there tends to be generally rising air and a lot of heat released in the rains, and some of that air was coming down over southern Russia. “What goes up, must come down”. We can demonstrate a direct link between the anticyclone over Russia and the monsoon rains over southeast Asia. This is in addition to the waves in the jet stream.
Under normal circumstances, it is not unusual for this pattern to develop over Russia, but it normally lasts only a week or so. What is unusual is the persistence and duration of this, so that it lasted 5 weeks or so. Weather systems tend to wax and wane but the anticyclones that move through stall and strengthen systematically in the same region because of the influence from SE Asia through the overturning monsoon circulation and the associated wave patterns.
In this way, we can assign blame for the atmospheric pattern to that of the sea surface temperatures, and the current La Nina. The latter determines the pattern. The elevated SSTs in the Indian Ocean and Indonesian region arise because of global warming and the effects of the last El Nino, and bolster the amount of water vapor available for all the storms, resulting in the excessive rains and flooding.
So there is a chain of events here, and several things have come together to make it record breaking. But it is not unexpected, even if it is not predictable more than a couple of weeks in advance.
Global warming plays a role by 1) elevating the SSTs in the Indian Ocean and Indonesian region, where it contributes to the excessive moisture and rains that gave the flooding over Pakistan, India and China; and 2) In Russia by adding to the heat and drying, making the drought more intense, longer lasting, and with stronger and record breaking heat waves. These events would not have happened without global warming
Did the ’tiser provide an online version, with links?
As far as I know, there was no online version. I added the links for the BNC post.
Peter Lalor,
We are getting off topic here but I cannot let your comment go unchallenged. There is nothing remarkable about the hot summer around Moskow this year.
I wonder what Kevin Trenberth has to say about the summer of 1540 when several major rivers including the Seine in Paris dried up?
Back to flooding. While severe flooding in Pakistan and elsewhere this year has been quite shocking, I wonder how we would have reacted to the kind of flooding that occurred in 1931. Back then, there was no television to bring the harrowing reality into our living rooms.
In 1931 the flooding of the Yangtze, Yellow and Huai rivers killed over 1.3 million people. Some estimates put the death toll more than three times higher. Global temperatures were rising rapidly in the early thirties (peaking in 1934). While one might suggest that global warming played a part in that disaster, the warming back then was entirely of natural origin.
@Camel: the desperate, pleading mental pathology of climate denialists intrigues me; if I did not know a fellow here who is well-versed in natural science, a birdwatcher etc. and also a denialist, I would find it incredible.
However, history is full of intelligent analytic people with advanced nat. science degrees being driven by other agendas, eg personal equity stakes in benevolent US capitalism spreading democracy via unmanned drones and renditions, across offshored US jobs and Macdonaldised wages, so QED.
Have a look at the letter to “Nature” of Jan 2004 in which various Swiss researchers put the chance of the fatal Europe summer of 2003 being due to chance alone at one in several billion.
Peter Lalor,
If you want to be truly amazed, check out this lot:
http://www.galileowaswrong.com/galileowaswrong/
GC …
And your reasoning for this claim would be …?
One has to laugh.
[…] And even though I’m not a skeptic on climate change, I have always loathed the easy and glib way that dissenters are labelled as “denialists”, as if they’re up there with the likes of David Irving or Lord Christopher Monckton. That’s an awful term. This post is an example of what seems to me to be a pretty reasonable tone (Do the recent floods prove man-made climate change is real?). […]
“Does all the recent rain across the country prove man made climate change is real?“
It’s a pretty silly question really.
We know climate change is real because over 2,000 weather stations across Australia tell us that average temperature has increased and average precipitation has decreased in most inland areas over the past 100 years.
We know most of this change is man made because we know that atmospheric CO2 has increased by about 40% over the past 100 years or so; we know where it came from, where it has gone and what it is doing when it gets there because we know it absorbs radiation with a major peak at around 15 microns.
Climate is the average of weather events at a particular point over a number of years hence information about a single weather event tells you nothing about climate, no matter how extreme it is. Simple physics tells us that 0.8 degrees average temperature increase is expected to increase the frequency and severity of high rainfall events in many areas and this is exactly what has been observed globally over the past few years. The relevant question then is whether the severity of the recent high rainfall event in central and south-east Australia was increased by climate change and the answer to that question is yes, the probability of this is very high.
More importantly, the increasing frequency and intensity of high rainfall events plus the increasing frequency and intensity of extreme heat events observed globally over recent years is being driven by increased greenhouse gases and it is this change over many years in the average frequency and intensity which is the proof of man made climate change. It follows that a majority of the deaths and misery caused by these events is the cost of man made climate change today.
An even greater worry is that this is not the new normal. This is just the beginning. This is what 0.8 degrees of average warming has done. Due to the thermal inertia of the oceans and because the task of reducing greenhouse emissions is so great we believe we have already locked in 2 to 3 degrees of warming and the clock is still ticking.
One of the signs of insanity is to keep repeating the same action while expecting a different outcome. We cannot reduce our greenhouse gas emissions by just 5% over 20 years and expect climate change and its tragic consequences to stop happening.
Geoff Cameron: “…increasing frequency and intensity of extreme heat events observed globally over recent years. ”
Geoff, where can we find the recorded evidence for this?
Ewen Laver,
At the risk of provoking more merriment, the atmospheric CO2 concentration in 1930 was ~305 ppm compared to pre-industrial levels of ~285 ppm. Even if one accepts the concept of positive climate feedbacks an increase of this magnitude is far too small to cause a measurable increase in global temperatures.
Nevertheless, we had a warming period in the early thirties and many more before that, all of which were natural in origin.
@gallopingcamel
The book ‘Sustainable Energy’ by Prof. Mackay is often quoted on BNC, but I’m guessing not for this reason. Check out this section in his book –
http://www.inference.phy.cam.ac.uk/withouthotair/c1/page_6.shtml
After looking at that graph, I think it would be a massive coincidence if increases in CO2 concentrations were NOT caused by human activity.
Huw Jones,
The link you sent makes perfect sense. Humans have caused significant emissions of CO2 that correlate closely with a rise in atmospheric CO2 concentration. While correlation does nor imply causation, I agree with Prof. Mackay.
By my calculations, human emissions should have caused the CO2 concentration to increase by 180 ppm (to 465 ppm) rather than the measured increase of 100 ppm. Apparently the planet is absorbing some of the CO2 we are producing. I suspect you are in favor of reducing CO2 concentrations just as I am. Probably we can also agree that building a nuke per day would get the job done quicker than any other “solution”.
I also agree with Barry when he says that higher global temperatures will increase the risk of flooding.
Here are a couple of questions on which we may differ. They may be “Off Topic” for this thread:
Does increased CO2 concentration in the atmosphere have a significant effect on the average global temperature?
From a human perspective, should we prefer a warmer climate than today or a cooler one?
My homeland is Wales; a name like Huw Jones suggests that you may have relatives there.
[QUOTE] While correlation does nor imply causation, I agree with Prof. Mackay. [/QUOTE]
I agree with your sentiments, but looking at that graph, it would be a huge coincidence if there wasn’t a correlation! Also, I learned recently that we have ‘carbon dated’ the atmosphere to determine its origin.
[QUOTE] By my calculations, human emissions should have caused the CO2 concentration to increase by 180 ppm (to 465 ppm) rather than the measured increase of 100 ppm. Apparently the planet is absorbing some of the CO2 we are producing. [/QUOTE]
Sounds about right, I think about 40% was absorbed by the oceans so 0.6*180 = 108.
[QUOTE] Probably we can also agree that building a nuke per day would get the job done quicker than any other “solution”. [/Quote]
I agree, I was thinking about this recently actually. The AP1000 is built at about 1MW/day, so if we can get 700ish in construction simultaneously around the world, we will do it. Also, I’ve thought of a way we can go pursue conservation and nuclear quite harmoniously without suffering the wrath of the ‘jevons-brooks postulate’ but I wont let the discussion get too off topic.
[QUOTE] Does increased CO2 concentration in the atmosphere have a significant effect on the average global temperature? [/QUOTE]
This is something I’ve been interested in. I’ve been trying to find a guide to how atmospheric CO2/other factors has had an effect on temperatures in the past, but I’ve been unable to find one atm.
[QUOTE] From a human perspective, should we prefer a warmer climate than today or a cooler one? [/QUOTE]
The only thing I have to go on is Mark Lynas’ ‘Six Degrees’, which is a survey of scientific papers on the topic. It seems the ratio of bad/good effects increases as the temperature goes up. Also, there have been massive die offs with around 5 degrees warming in the past.
[QUOTE] My homeland is Wales; a name like Huw Jones suggests that you may have relatives there. [/QUOTE]
I can do better than that, I live in Wales! Some of my family emigrated to an Australian farm when I was young (I think they are still there). We were supposed to go with, but we never did.
What happened with the quotes :S
Huw Jones,
That comment about correlation not implying causation was a generalization and was not intended as weasel words to undermine your argument. By agreeing with Prof. Mackay I meant that CO2 emissions from human activities are indeed causing the rising CO2 concentrations in the atmosphere.
Cymru am byth. I was born in Pembrokeshire and lived on a farm with no electricity until 1948. Our lighting was from oil lamps, our water was hand pumped and our sewage system beggared description. Maybe that is why I am so keen to bring electricity to the third world.
Regarding storms my understanding was that global warming would be apparent most in winter and at night and that it would likely reduce the temperature differentials associated with night/day and north/south. As such whilst flooding may increase wouldn’t we expect storms, as in wind, to decline?
“We know climate change is real because over 2,000 weather stations across Australia tell us that average temperature has increased”
Yeah? Where?
http://www.addinall.net/ausclimate/100yrural/
http://www.addinall.net/antarctica/
I can’t see a warming trend here. Can anyone?
But keep up ith the nuclear debate. Good value. Did anyone see Luddlum’s crap in today’s Australia?
The man is a joke.
TerjeP,
That makes two of us who think that global warming will tend to reduce the violence of storms, even though it will bring more precipitation.
Addinall – I looked at several of the charts you posted. It’s hard to see a rising trend. Some e.g. Deniliquin show a big decline since 1880. It would be interesting to see a statistical analysis of the data. Several posters have alluded to increasing frequency of ‘severe weather events’ (floods, torrential rain, hurricanes, heatwaves). I am looking for recorded eveidence of this, but can’t find anything that isn’t just anecdotal. The general impression of the weather (which reflects climate in the long term) in the Northern Hemisphere is that there has been no overall change in 30 years, and in fact is becoming steadily colder.
Yes Addinall,
Ludlam IS a joke. It’s hard to ,believe that anyone could believe the bilge he wrote, but obviously many still do. Aaarrgghh!!
@Addinall
You could start by looking at authoritative sources, where they do a little more analysis than eyeballing cherry picked data sets:
http://www.bom.gov.au/climate/change/aus_cvac.shtml for Australia
or
http://data.giss.nasa.gov/gistemp/ for global
Addinall and John McEvoy and others who seek reliable information about the current Australian climate read this
http://www.bom.gov.au/inside/eiab/State-of-climate-2010-updated.pdf
or try NOAA for the global climate
http://www.noaanews.noaa.gov/stories2010/20100915_globalstats_sup.html
I prefer to trust in these climate authorities – they seem to dispute you claims.
Quokka – we must have been typing simultaneously:) Great minds think alike 😉
Wow, Addinall’s links are ridiculous. “Let’s cherry pick 25 or so weather stations and say we can’t see a trend”. I’m unsure whether this stems for scientific illiteracy or just plain dishonesty.
Every bit as ridiculous as Ludlam.
How was Addinall’s data ‘cherry picked’?
Maybe somebody can ‘cherry pick’ a data set to demonstrate the opposite?
“How was Addinall’s data ‘cherry picked’?”
By looking at a select few stations which suits his argument, and ignoring the rest.
“Maybe somebody can ‘cherry pick’ a data set to demonstrate the opposite?”
No, that’s not how science works. To look at global trends you use all of the data available, globally. Perhaps take the time to look at some of the IPCC reports to see how this works.The work of many climate scientists “demonstrates the opposite” (i.e. a global warming trend).
If the Australian climate is showing a generalised warming pattern, how could there be 27 seperate weather recording stations where that effect doesn’t show up?
Question to Addinall: Did you make a selective choice of stations?
John McEvoy
Follow the link, which I posted above, to the Australian BOM
“State of the Climate 2010″ read it and you will have your questions answered.
Stations were selected on the criteria:
The stations had to have provided 100 years of recording to be included.
The stations were not to be inner city and affected by UHI.
The stations had to have been geographicall stable durin that period (within reason).
Based on those criter, EVERY station available has been used.
That is not cherry picking, that is an experimental methodoloy.
HTH.
I can’t dispute that global warming will bring more rainfall and more flooding. Also it will cause sea levels to rise making life difficult for New Orleans, Holland, Florida (where I live) and other low lying areas around the world.
What I dispute is the idea that these and other negative consequences of global warming come close to out weighing the benefits such as:
1. More land available for agriculture.
2. Greater agricultural productivity owing to higher temperatures.
3. Greater agricultural productivity owing to higher levels of CO2 in the atmosphere.
4. Longer growing seasons.
5. Less violent storms.
6. Fewer arid areas and deserts.
The CSIRO document ‘State of the Climate 2010′ states: The carbon dioxide concentration in 2009 of 386 parts per million (ppm) is much higher than the natural range
of 170 to 300 ppm that has existed in the atmosphere for at least the past 800,000 years and possibly the past 20 million years.
The suggestion is that CO2 is ‘naturally’ in the range of 170 to 300 ppm. The following dataset suggests otherwise: http://www.global-samizdat.org/Global-Samizdat/GS8-GlobalLie1/ImageFiles/GlobalTempAndAtmospheric.gif
I looked at the CSIRO ‘State of the Climate 2010′ document link kindly provided by Ms Perps. On the first page, under Key Points, it says ‘All of Australia has experienced warming over the last 50 years’.
Of course this is true, and is demonstrated by the data posted by Addinall. What is does not say, however, is ‘All of Australia is warmer than it was 50 years ago’.
This is borne out by Addinalls data. Addinall has provided a clear explanation for the selection of his data sets, which doesn’t look particularly like cherry picking to me. It certainly doesn’t deserve the description ‘ridiculous’ posted by Tom Keen.
The CSIRO report says that mean temperature has increased by 0.7C since the 1960′s with a variance of 0.5C. If the variance is 70% of the mean, doesn’t that put a low weight of confidence on the figure?
Moreover, many of Addinall’s temperature records show a distinct maximum around the early 1900′s, and a distinct low around the 1960′s. This looks like time-axis cherry picking by the CSIRO.
Perhaps somebody could provide a proper statistical analysis of the data in Addinall’s records?
Yeah, I keep noticing the shift in the time windows. I read the paper and it gave no explanation on why this start dtate has become the magic one this month.
I only got interested in that data because someone told me once that it was ‘statistically proven’ that Australia was x.x degrees warmer than it as 100 years ago. Being an old ABS geek, I had to have a quick look. My method was honest. Excluding the temperatures taken in the middle of a largest cities I think it is fair enough. I have NO doubt in my mind that the corner of Creek Street and Queen street is hotter now than is was in 1910. And when did the ability to ‘eyeball’ data become a sin? A lot of my early work was Statistical Process Control,measuring the temperatures of things funnily enough! 😉 Bein able to sniff out ‘funny’ data or algorithm behaviour used to be seen as a blessing…%-?
Now, SOMEONE here just recently, that it was a sin not to use ALL data available. So why start counting in 1960?
Anyway, I used ALL data from ALL stations in Antarctica, ’cause I figured I could safely omit and concerns of UHI effect. Again, I couldn’t see a warming trend, apart from one small area that seems to be sitting on top of a shallow, young, active volcano.
A very good mate of mine was a scientist with the AAD until recently, so every now and again I’d google upsome interesting facts about Antarctica. Anecdotally, from fishermen, strong sulfur smells reported in that area, and steam rising from the surface.
Now, without putting to fine a point on it, that jangles the bell tied to my Occam’s Razor.
PS. I still think the site is one of the very best on the web.
Take a look at this paper for an analysis of antarctic surface temperatures since 1957: http://www.nature.com/nature/journal/v457/n7228/full/nature07669.html
Note, in the abstract it states “the continent-wide average near-surface temperature trend is positive”, referring to a trend of ~0.1 degrees celcius of warming per decade. The work appears sound to me, and I’ve seen no paper or responses to dispute the findings. But please, enlighten me if this has been suggested as erroneous work.
I’d like to look at the Nature paper, but they want $32 for the priviledge! There is only a one-paragraph synopsis. An average trend of approximately 0.1C per year with a variance of 0.5C sounds like a difficult thing to pin down. Particularly if one of your weather stations is sitting over a steaming volanic geyser….
Regarding ‘eye-balling’ of data, disparaged above by Terry Krieg, this is actually a very powerful way to analyse graphic representation of data by the practiced eye in the first instance. I spent many years doing this with borehole logging data. There are very few types of data set that will subsequently reveal something qualitatively different under a mathematical analysis.
@John McEvoy
I was the one who made the “disparaging” comment, and I don’t retract it.
For the global temperature record, the multiple data sets must be gridded or spacially smoothed. Eyeballing a few thousand time series is NOT the way to go about it. Highly capable and experienced people in UEA, NASA and NCDC have done this for the surface temperature record and and from UAH and RSS for the satellite record. The results are all quite close and all show about the same degree of warming. UAH record is maintained by contrarians Spencer and Christie.
Multiple science bloggers have also had a go, using the freely available global station data from NCDC. They also come up with about the same degree of warming as the authoritative records. That includes a few of the honest contrarians who still couldn’t come up with a result other than that the planet is warming and by about the same same amount.
The methodology for the NASA GISS record is documented on their web site and the source code for the production of the temperature record is also freely available.
If you think you can do better, then by all means have a go. Either produced a considered critique of for example the GISS methodology or better still your own temperature record.
Bet you can’t.
Quokka
The subject under discussion is the Australian, rather than global, temperature records, in particular the data link posted by Addinall. Perhaps you can tell us what’s wrong with that data – it clearly doesn’t demonstrate warming in the last 100 years.
What I said about global temperature record is equally true of Australia. You cannot just eyeball some station time series and get continental average. It’s just nonsense. The whole thing needs to be gridded, and as I see no evidence of any such analysis by the deniers here, I will if you don’t mind, go with those who do the job properly.
Temperate anomaly records are not just derived by a simple arithmetic mean of all available stations. How hard is this to understand?
Do you think the people at the BOM and CSIRO are fools?
The recording staions are spread out all over Australia. That’s a form of grid. Who suggested temperature anomaly records are derived from a simple arithmetic mean? You did not answer my question – what’s wrong with Addinall’s data?
You cannot simply dismiss 100 years of information from 27 stations as ‘nonsense’. The data may be inconvenient, but it certainly isn’t nonsense. I am not inclined to respond to any more of your posts because this is a science discussion site and I don’t like your anonymous aggression.
John McEvoy, may I ask where on earth the data is for that graph you provided, supposedly showing the last 800,000 years of CO2 concentrations? I also wonder why I haven’t seen this published in any reputable journal(s) (or any journal at all, for that matter)?
Because according to this paper, the statement that atmospheric CO2 concentration is higher now than any other time in the past 800,000 years is correct. Here’s a free summary of those findings, graphs included http://www.nature.com/nature/journal/v453/n7193/full/453291a.html
And according to this paper, we’re well on our way to having the most acidic oceans of the past 800,000 years, due to elevated atmospheric CO2. That’s if we haven’t passed that point already.
Sorry, link for ocean acidity: http://www.nature.com/nature/journal/v425/n6956/abs/425365a.html
http://www.scientificamerican.com/article.cfm?id=acidic-oceans
“what’s wrong with Addinall’s data?”
It’s not the data, it’s what is being inferred from it. I.e. “I can’t see a warming trend here”
Why are only maximum temperatures being displayed?
What criteria is used for assessing UHI significance? (only 27 stations out of 2000 in Australia?!).
Why ignore ALL other stations completely? What is the basis of assuming that ~2000 weather stations don’t have usable data?
What criteria is used for determining significance of geographic stability? And why?
Where are the trendlines? Eyeballing data for individual sites doesn’t suggest anything.
More on atmospheric CO2 levels:
“During the Middle Miocene, when temperatures were ~3° to 6°C warmer and sea level was 25 to 40 meters higher than at present, pCO2 appears to have been similar to modern levels. ”
http://www.sciencemag.org/cgi/content/abstract/1178296
“You would have to go back at least 15 million years to find carbon dioxide levels on Earth as high as they are today, a UCLA scientist and colleagues report Oct. 8 in the online edition of the journal”
http://www.newsroom.ucla.edu/portal/ucla/last-time-carbon-dioxide-levels-111074.aspx
“what’s wrong with Addinall’s data?”
Not mine, belongs to BoM.
“It’s not the data, it’s what is being inferred from it. I.e. “I can’t see a warming trend here””
I can’t. It isn’t there.
“Why are only maximum temperatures being displayed?”
Because that is wha the BoM tool offered.
“What criteria is used for assessing UHI significance? (only 27 stations out of 2000 in Australia?!).
Why ignore ALL other stations completely? What is the basis of assuming that ~2000 weather stations don’t have usable data?”
The 2000 stations did not have a 100 year history. Only about 34 did. I excluded Brisbane central, Perth Central, Sydney Central….
And used all of the rest.
“What criteria is used for determining significance of geographic stability? And why?”
Moving from a paddock to the top of a building would be an exclusion. UHI.
“Where are the trendlines? Eyeballing data for individual sites doesn’t suggest anything
Of course it does.
I am just human and I have a big imagionation, as do all of you…. Have you ever thought its is the sign of the times.. do you beleive that its has all happened before and this is just one small piece of the design….I was just reading that God governs over Isreal and his people and he looks upon them…. it was strange for me to see that it flooded over there it is not something you see everyday…..Reguardless of what we are or not doing the design is written and we Choose most of the stuff that is happening.. Isnt that neat.. to realize we ARE doing destuctive things and we reap those concequences…. I am so excited to see it in my life time……
Link 1 provided for ocean acidity by Tom Keen:
“Most carbon dioxide released into the atmosphere as a result of the burning of fossil fuels will eventually be absorbed by the ocean1, with potentially adverse consequences for marine biota2, 3, 4. Here we quantify the changes in ocean pH that may result from this continued release of CO2 and compare these with pH changes estimated from geological and historical records. We find that oceanic absorption of CO2 from fossil fuels may result in larger pH changes over the next several centuries than any inferred from the geological record of the past 300 million years, with the possible exception of those resulting from rare, extreme events such as bolide impacts or catastrophic methane hydrate degassing.”
“Will eventually…potentially adverse…estimated…may result…over the next several centuries…”
Not what any Court would accept as incontrovertible evidence.
Link 2: In the second link, the headline trumpets: “Oceans Turn More Acidic Than Last 800,000 Years!!”
But this ‘fact’ is never mentioned again in the article which says, rather limply, “CO2 emissions COULD alter the chemistry of the world’s oceans”. Then they announce a ‘plan’ to measure it. Just a plan – there are no data yet. Finally the article says rather vaguely “..That has resulted in water 30 percent more acidic than it was..”
So how acidic was it in the first place? Bear in mind that a pH of 6.99998 (with an ‘acidity’ of 0.00002)is ’100% more acidic’ than a pH of 6.99999 (with an ‘acidity’ of 0.00001).
I don’t t understand how these links offered evidence of ocean acidity.
According to this paper http://www.agu.org/pubs/crossref/2004/2004GB002247.shtml, ocean acidity was 8.179 pre-industrial, it is now around 8.069.
“Bear in mind that a pH of 6.99998 (with an ‘acidity’ of 0.00002)is ’100% more acidic’ than a pH of 6.99999 (with an ‘acidity’ of 0.00001).”
That statement is patently incorrect. Acidity is measured based on ion (H+) concentration. The pH change of -0.11 is a 28.8% increase in H+. I.e. a ~30% increase in acidity.
“I don’t t understand how these links offered evidence of ocean acidity.”
It’s not that difficult. Most CO2 from the atmosphere ends up in the ocean. This leads to acidification. There has been an observed increase in ocean acidity. This is due to humans increasing atmospheric CO2 concentrations, which is very well documented. That changes in pH can and do affect biological systems is also very well documented.
Are we really going to get into a debate about ocean acidification as well as climate change?
Southern California records record all time high temperatures:
http://climateprogress.org/
Link should be http://climateprogress.org/2010/09/28/1california-prop-23-los-angeles-heat-wave/
What I said about global temperature record is equally true of Australia. You cannot just eyeball some station time series and get continental average. It’s just nonsense. The whole thing needs to be gridded, and as I see no evidence of any such analysis by the deniers here, I will if you don’t mind, go with those who do the job properly.
Temperate anomaly records are not just derived by a simple arithmetic mean of all available stations. How hard is this to understand?
Do you think the people at the BOM and CSIRO are fools?
Of course you can’t treat climate data simplistically. If you do, the data does not provide the scare when looked at without being ‘corrected, gridded, smoothed, dropped, lost, guessed at….’
The statement made to me was “It is STATISTICALLY PROVEN that Australia is X.x degrees warmer now than it was 100 years ago”.
Now, how does one test that hypothesis? Is anyone REALLY suggesting that to do so I should look at data gathered over the last 60 years, treat it to some unknown (f(x)), and guess at the bits where data is missing?
What method do you all recommend? I have only been doing statistics for a quarter century or so, I need a little help here.
Addinall – no, I totally agree with you. My post was just a cut-and-paste of ‘quokka’s’ earlier response to your data to his post about a US heatwave. He rubbished your station data on the grounds it hasn’t been ‘gridded’ but then posts a link to news of a California heatwave as evidence of global warming. So when it’s cold it’s statistically insignificant weather, but when it’s hot it’s definitely AGW…
But just how do you ignore 27 sations spread out all over Australia that clearly show it’s a lot cooler now than it was 100 years ago? I would also like some help here.
..and the article pointed out that the heatwave comes at the end of a long and unusually cool summer.
“So when it’s cold it’s statistically insignificant weather, but when it’s hot it’s definitely AGW”
You know very well that’s a fallacious argument. Actually, no, it’s patently dishonest. No one is saying DEFINITELY. But globally we are experiencing more extreme hot weather events than extreme cold weather events.
“But just how do you ignore 27 sations spread out all over Australia that clearly show it’s a lot cooler now than it was 100 years ago”
They don’t show it’s a lot cooler. For a start they only show mean maximum temperature. It’s well documented that minimum temperatures have warmed faster than maximum in Australia. Those datasets don’t even show that maximum temperatures are cooler, many of them seem to have a positive trend (it’s very, very difficult to tell without a trend line).
As this paper states in its abstract, “Consistent with global trends, Australia has warmed ∼0.8°C over the last century with minimum temperatures warming faster than maxima.”
addinall and John McEvoy have failed to provide a single reference to any peer-reviewed papers which suggest any of these findings are incorrect. So please, if you think these findings are incorrect, please provide us with some references to studies which refute the findings of the BoM, NASA, CSIRO, NOAA, or any of the findings of the references I have provided in this thread.
@John McEvoy – I figured out those were not your sentiments!
@Tom Keen
So, let’s test another hypothesis….
“Consistent with global trends, Australia has warmed ∼0.8°C over the last century with minimum temperatures warming faster than maxima.”
– how was this measured?
– what data was used (I produced the data I used)?
Upon investigation…..
“Australia lacks the long-term datasets”
I gathered all of the long term data sets for you. Peer review tham for me and tell me if you can find a warming trend.
” and tradition of phenological monitoring that have allowed the detection of climate-change-related trends in the Northern Hemisphere. Long-term changes in Australian vegetation can be mostly attributed to alterations in fire regimes, clearing and grazing,”
Indeed.
“but some trends, such as encroachment of rainforest into eucalypt woodlands, and establishment of trees in subalpine meadows probably have a climatic component. Shifts in species distributions toward the south (bats, birds), upward in elevation (alpine mammals) or along changing rainfall contours (birds, semiarid reptiles), have recently been documented and offer circumstantial evidence that temperature and rainfall trends are already affecting geographic ranges.”
So the METHOD is to IGNORE the available long term datasets, and hazard a wild guess by following a bat around! TRULY AMAZING! Did it ever occur to anyone else that bats and birds MIGHT just be re-locating because of habitat destruction?
I dont need a reference to refute it. I can do that all on my own. I just did. I read it.
If this is the outcome of ‘peer review’ then it truly has become a worthless pastime.
I don’t care how many people are in a fan club. If the data does not fit the hypothesis, then the hypothesis is wrong. You don’t manipulate the data to suit, or just ignore that which does agree with you.
“Those datasets don’t even show that maximum temperatures are cooler, many of them seem to have a positive trend (it’s very, very difficult to tell without a trend line).”
You jest!
@Tom Keen
Indeed. They think that science is some sort of juvenile debating game. The nonsense posted here would not pass muster for a high school science assignment. Eyeball some hand picked time series – grade D-.
If Adinall thinks BOM got it wrong there is clearly scope to do better by producing a temperature record for Australia using open properly documented methodology showing what the temperature trend is.
As Phil Jones remarked, this is not rocket science. Any decent programmer with a modest amount of mathematics should be capable of making a decent stab at it. Perhaps not up to the high standard of respected bodies such as BOM and NASA, but worthy nevertheless.
The fact that no such effort has been made shows quite clearly that they are all talk and no trousers and are not in fact actually interested in the temperature trend, but only in playing a stupid game of doubt and confusion.
“Indeed. They think that science is some sort of juvenile debating game. The nonsense posted here would not pass muster for a high school science assignment. Eyeball some hand picked time series – grade D-.”
Wow! Ad hom from something called a Quokka.
Warmies can get really quite touchy when the religion is held up to examination. Give it up kid, I grew up in aus.flame. I thought this was a science site?
Now, back to the thread…
“If Adinall thinks BOM got it wrong there is clearly scope to do better by producing a temperature record for Australia using open properly documented methodology showing what the temperature trend is.”
http://www.addinall.net/ausclimate/100yrural/
BoM Data. BoM Tools. BoM display. My laptop.
“As Phil Jones remarked, this is not rocket science. Any decent programmer with a modest amount of mathematics should be capable of making a decent stab at it. Perhaps not up to the high standard of respected bodies such as BOM and NASA, but worthy nevertheless.”
I’m MUCH better than decent! The ABS thought I was quite a nifty programmer, as did the ISSB and several others. When DuPont asked me to provide Statistical Process Control and SCADA software in munitions manufacture, they expected me to use ACTUAL data. Not follow a squirrel around the roof and try to guess the process temperature by observing the furry little beasts meandering around. I thought that was fair as getting it wrong ends with a very large BANG!
“The fact that no such effort has been made shows quite clearly that they are all talk and no trousers and are not in fact actually interested in the temperature trend, but only in playing a stupid game of doubt and confusion.”
Busy people don’t spend a lot of time chasing around nonsense. The statement was made to me that “IT IS STATISTICALLY PROVEN THAT AUSTRALIA IS X.x DEGREES WARMER NOW THAN IT WAS 100 YEARS AGO”. Not my statement. So I looked for available data, found it at BoM.
Returnig to BoM tonight, I see that the format has changed, however, just ‘eyeballing’ a few:
http://www.bom.gov.au/jsp/ncc/cdio/weatherData/av?p_display_type=dataSGraph&p_stn_num=038003&p_nccObsCode=122&p_month=13&p_startYear=2010
http://www.bom.gov.au/jsp/ncc/cdio/weatherData/av?p_display_type=dataSGraph&p_stn_num=009510&p_nccObsCode=122&p_month=13&p_startYear=2010
Still doesn’t look very drastic to me. Feel free to work through my list yourself. Some of the datasets seem to disappeared in the eleven months since I had a quick peek. Places like Deneliquin no longer exist.
And quite a few towns that seemed to be significantly warmer in the dim dark ages have also been de-materialised. And others, all the data prior to 1966 seems to have been misplaced somewhere. Very odd.
@addinall
Crikey, you went to all the trouble of saving some screenshots of some charts of hand picked stations from the BOM web site. You call that analysis?
Nobody cares. At issue here is the nonsense you are peddling about change in the Australian climate. And nobody cares about your claims to have a special ability to substitute eyeballing for rigorous analysis.
The last refuge of scoundrels – conspiracy theories.
Here’s a handy tip. The BOM has all the station data available for download. Here is a representative page http://www.bom.gov.au/jsp/ncc/cdio/weatherData/av?p_nccObsCode=122&p_display_type=dailyDataFile&p_startYear=&p_stn_num=38003
Notice that each page has a unique URL making it rather easy to iterate over the entire temperature record for all stations and download the lot into for example a MySQL database, from which you can start some proper analysis. I reckon I could get to that point with about a day’s work.
But it seems, busy person that you claim to be, cannot even be bothered putting that much effort and prefer to insult the intelligence of the readers of the fine blog with claims of your special ability to eyeball screenshots of some charts of hand picked stations. Give it a break.
Is this denialist clown “Addinall” some sort of word game?
As in: “add n’all…? Not much of the “all”, too little “addition”. The fellow looks pretty subtracted to me actually, more asymptotic to zero, in fact.
Wouldn’t you know it, Australia is not alone in the world?
Ever heard of the difference bertween weather and climate, even assuming your alleged blips in Australia stand up to scrutiny?
You remind me of the US redneck podcaster recently who, experiencing an ice storm in Texas on his “prahpertee”, blithely ignored the historical heat record in the last Canadian winter on the same N. American continent by sneering at the “polar bear-hugging, red wine drinking, Al Gore-voting bicycle riders”.
And I already referenced on BNC cliamtologist Kevin Trenbarth showing that the Russian heatwave just now is AGW, no question.
“So the METHOD is to IGNORE the available long term datasets, and hazard a wild guess by following a bat around”
“Australia lacks the long-term datasets”
If you actually read the abstract, in that case, you would know that this is referring to phenological monitoring, not climate records. The climate modelling shows a warming trend in Australia. The phenological studies show trends consistent with that of these climatic shifts. Here, the entire paper is available for free.
Here is a summary of regional temperature trends since 1910 in Australia, for SE, NE, SW, NW. Quality of data is explicitly considered. So please, explain those trends. How or why are they incorrect?
It seems you’re “just ignoring that which does not agree with you”. You attacked quokka for using ad hominems (they weren’t true ad hominems), then played the authority on the matter, i.e. “I’m MUCH better than decent!” That’s plain hypocrisy.
“all the data prior to 1966 seems to have been misplaced somewhere. Very odd.”
Yes, of course. It’s all a consipiracy. Please.
[…] This is an interesting addition for me, coming on the back of the recent blog post I wrote, “Do the recent floods prove man-made climate change is real?“. […]
@ Tom Keen
It’s quite clear that 2 out of the 4 sectors show a slightly increasing maximum trend over the last 100 years, whilst 2 sector maximum trends are practically flat. That is, if we are permitted to ‘eyeball’ the data rather than submit it to some kind of analysis first as suggested elsewhere in this blog. I read the paper by Hughes on climate change. He says in his introduction “The warming trends, together with changes in rainfall and sea level, APPEAR to be now discernible above natural decadal and century-scale variability” but nowhere does he substantiate this conjecture. The paper goes on to discuss the effect of climate change on species and ecosystems in what is an undoubtedly thorough and accurate piece of research. The paper, however, has nothing to offer concerning evidence of AGW. Instead Hughes opens with a ‘debate-is-over’ statement that “Climate change as a result of the enhanced greenhouse effect is no longer a hypothesis”. Nowhere does he attempt to show why.
“The paper, however, has nothing to offer concerning evidence of AGW. Instead Hughes opens with a ‘debate-is-over’ statement that “Climate change as a result of the enhanced greenhouse effect is no longer a hypothesis”. Nowhere does he attempt to show why.”
John, I referenced that paper simply to illustrate the quote “Consistent with global trends, Australia has warmed (approximately) 0.8°C over the last century with minimum temperatures warming faster than maxima.” He has referenced other papers within the body of the text to support that statement. As I’ve already said, that paper is a phenology based study. He doesn’t need to explain why the climate is changing at the rate it currently is. That’s already well established through decades of climate research. There is nothing in the peer-reviewed literature which substantially suggests otherwise.
What this paper does conclude is that “temperature and rainfall trends are already affecting geographic ranges” and “Interdisciplinary collaboration between climatologists, modellers, physiologists, palaeoecologists and resource managers, to name just a few, is urgently needed.” The former quote is particularly worrying, as climatic changes in synergy with habitat destruction, fragmentation and other factors greatly increases the likelihood of accelerated species extinction – and we are already witnessing a mass extinction event.
@John McEvoy
If it is evidence of anthropogenic global warming that you require then I strongly recommend the large amount of material here:
Empirically observed fingerprints of anthropogenic global warming
Taken together these multiple lines of evidence allow for no other conclusion than that the planet is warming and humans are responsible.
Here is a copy of a recent letter from Harold Lewis, Emeritus Professor of Physics at the University of California, Santa Barbara, to Curtis G. Callan Jr, Princeton University, President of the American Physical Society (APS).
Why would Prof. Lewis write such a letter?
Dear Curt:
When I first joined the American Physical Society sixty-seven years ago it was much smaller, much gentler, and as yet uncorrupted by the money flood (a threat against which Dwight Eisenhower warned a half-century ago). Indeed, the choice of physics as a profession was then a guarantor of a life of poverty and abstinence—it was World War II that changed all that. The prospect of worldly gain drove few physicists. As recently as thirty-five years ago, when I chaired the first APS study of a contentious social/scientific issue, The Reactor Safety Study, though there were zealots aplenty on the outside there was no hint of inordinate pressure on us as physicists. We were therefore able to produce what I believe was and is an honest appraisal of the situation at that time. We were further enabled by the presence of an oversight committee consisting of Pief Panofsky, Vicki Weisskopf, and Hans Bethe, all towering physicists beyond reproach. I was proud of what we did in a charged atmosphere. In the end the oversight committee, in its report to the APS President, noted the complete independence in which we did the job, and predicted that the report would be attacked from both sides. What greater tribute could there be?
How different it is now. The giants no longer walk the earth, and the money flood has become the raison d’être of much physics research, the vital sustenance of much more, and it provides the support for untold numbers of professional jobs. For reasons that will soon become clear my former pride at being an APS Fellow all these years has been turned into shame, and I am forced, with no pleasure at all, to offer you my resignation from the Society.
It is of course, the global warming scam, with the (literally) trillions of dollars driving it, that has corrupted so many scientists, and has carried APS before it like a rogue wave. It is the greatest and most successful pseudoscientific fraud I have seen in my long life as a physicist. Anyone who has the faintest doubt that this is so should force himself to read the ClimateGate documents, which lay it bare. (Montford’s book organizes the facts very well.) I don’t believe that any real physicist, nay scientist, can read that stuff without revulsion. I would almost make that revulsion a definition of the word scientist.
So what has the APS, as an organization, done in the face of this challenge? It has accepted the corruption as the norm, and gone along with it. For example:
1. About a year ago a few of us sent an e-mail on the subject to a fraction of the membership. APS ignored the issues, but the then President immediately launched a hostile investigation of where we got the e-mail addresses. In its better days, APS used to encourage discussion of important issues, and indeed the Constitution cites that as its principal purpose. No more. Everything that has been done in the last year has been designed to silence debate
2. The appallingly tendentious APS statement on Climate Change was apparently written in a hurry by a few people over lunch, and is certainly not representative of the talents of APS members as I have long known them. So a few of us petitioned the Council to reconsider it. One of the outstanding marks of (in)distinction in the Statement was the poison word incontrovertible, which describes few items in physics, certainly not this one. In response APS appointed a secret committee that never met, never troubled to speak to any skeptics, yet endorsed the Statement in its entirety. (They did admit that the tone was a bit strong, but amazingly kept the poison word incontrovertible to describe the evidence, a position supported by no one.) In the end, the Council kept the original statement, word for word, but approved a far longer “explanatory” screed, admitting that there were uncertainties, but brushing them aside to give blanket approval to the original. The original Statement, which still stands as the APS position, also contains what I consider pompous and asinine advice to all world governments, as if the APS were master of the universe. It is not, and I am embarrassed that our leaders seem to think it is. This is not fun and games, these are serious matters involving vast fractions of our national substance, and the reputation of the Society as a scientific society is at stake.
3. In the interim the ClimateGate scandal broke into the news, and the machinations of the principal alarmists were revealed to the world. It was a fraud on a scale I have never seen, and I lack the words to describe its enormity. Effect on the APS position: none. None at all. This is not science; other forces are at work.
4. So a few of us tried to bring science into the act (that is, after all, the alleged and historic purpose of APS), and collected the necessary 200+ signatures to bring to the Council a proposal for a Topical Group on Climate Science, thinking that open discussion of the scientific issues, in the best tradition of physics, would be beneficial to all, and also a contribution to the nation. I might note that it was not easy to collect the signatures, since you denied us the use of the APS membership list. We conformed in every way with the requirements of the APS Constitution, and described in great detail what we had in mind—simply to bring the subject into the open.<
5. To our amazement, Constitution be damned, you declined to accept our petition, but instead used your own control of the mailing list to run a poll on the members’ interest in a TG on Climate and the Environment. You did ask the members if they would sign a petition to form a TG on your yet-to-be-defined subject, but provided no petition, and got lots of affirmative responses. (If you had asked about sex you would have gotten more expressions of interest.) There was of course no such petition or proposal, and you have now dropped the Environment part, so the whole matter is moot. (Any lawyer will tell you that you cannot collect signatures on a vague petition, and then fill in whatever you like.) The entire purpose of this exercise was to avoid your constitutional responsibility to take our petition to the Council.
6. As of now you have formed still another secret and stacked committee to organize your own TG, simply ignoring our lawful petition.
APS management has gamed the problem from the beginning, to suppress serious conversation about the merits of the climate change claims. Do you wonder that I have lost confidence in the organization?
I do feel the need to add one note, and this is conjecture, since it is always risky to discuss other people’s motives. This scheming at APS HQ is so bizarre that there cannot be a simple explanation for it. Some have held that the physicists of today are not as smart as they used to be, but I don’t think that is an issue. I think it is the money, exactly what Eisenhower warned about a half-century ago. There are indeed trillions of dollars involved, to say nothing of the fame and glory (and frequent trips to exotic islands) that go with being a member of the club. Your own Physics Department (of which you are chairman) would lose millions a year if the global warming bubble burst. When Penn State absolved Mike Mann of wrongdoing, and the University of East Anglia did the same for Phil Jones, they cannot have been unaware of the financial penalty for doing otherwise. As the old saying goes, you don’t have to be a weatherman to know which way the wind is blowing. Since I am no philosopher, I’m not going to explore at just which point enlightened self-interest crosses the line into corruption, but a careful reading of the ClimateGate releases makes it clear that this is not an academic question.
I want no part of it, so please accept my resignation. APS no longer represents me, but I hope we are still friends.
Hal
“Yes, of course. It’s all a consipiracy. Please.”
I always prefer stupidity over conspiracy as an argument. Doesn’t explain why entire towns have vanished from the record over the last 11 months. Very disturbing.
Re the Harold Lewis letter. He sounds sincere. His suspicions about foul play are probably right. That still does not make his resignation reason to doubt man made climate change. It sounds like Mr. Lewis is more upset about being ignored than some attempt at a cover up.
Addinall, on 10 October 2010 at 19.59 — Enitre towns? What are you writing about? Megafloods?
@thoriumMST
Sincerity is not the issue. Much of the letter just sounds like the standard anti AGW kook. Sad really. If he has something to say from a scientific point of view rather than this rambling nonsense he should just say it.
Here is the APS statement. Straight forward and level headed in my view.
“Emissions of greenhouse gases from human activities are changing the atmosphere in ways that affect the Earth’s climate. Greenhouse gases include carbon dioxide as well as methane, nitrous oxide and other gases. They are emitted from fossil fuel combustion and a range of industrial and agricultural processes.
“The evidence is incontrovertible: Global warming is occurring. If no mitigating actions are taken, significant disruptions in the Earth’s physical and ecological systems, social systems, security and human health are likely to occur. We must reduce emissions of greenhouse gases beginning now.
“Because the complexity of the climate makes accurate prediction difficult, the APS urges an enhanced effort to understand the effects of human activity on the Earth’s climate, and to provide the technological options for meeting the climate challenge in the near and longer terms. The APS also urges governments, universities, national laboratories and its membership to support policies and actions that will reduce the emission of greenhouse gases.”
http://www.aps.org/policy/statements/07_1.cfm
[…] Do the recent floods prove man-made climate change is real? In this post, I said: Earlier this year in Australia, the Bureau of Meteorology released a Special Climate Statement on the recent exceptional rain and flooding events in central Australia and Queensland. February 28th 2010 was the wettest day on record for the Northern Territory, and March 2nd set a new record for Queensland. Over the 10-day period ending March 3rd, an estimated 403 cubic kilometres (403,000 gigalitres) of rainfall fell across the NT and QLD. Extreme, indeed. […]
[…] Do the recent floods prove man-made climate change is real? (Sept 2010) […]