


.png)
 Guest Post by Jani-Petri Martikainen. Jani-Petri is a theoretical physicist doing fundamental research in the field of ultracold quantum gases. Most of his current research activities are computational and involve bosonic or fermionic atoms in optical lattices. He has a lively interest on environmental, climate, and energy issues. He runs the blog PassiiviIdentiteetti, which is mostly written in Finnish.
————
By aggregating power generation from wind farms spread across the whole (North Sea) area, periods of very low or very high power flows would be reduced to a negligible amount. A dip in wind power generation in one area would balanced by higher production in another area. European renewable energy council and Greenpeace (page 34).
 Strangely, proponents feel comfortable in making such statements, but show a noticeable lack of interest in actually demonstrating whether the statements are true. Why is this? In science the burden of proof falls upon the claimant and it would be desirable if the same principle were to apply to discussions about energy policies. (Notice by the way, that EREC+GP are not even satisfied with claiming that wind speeds in different parts of the North Sea are uncorrelated, but actually claim that speeds are anti-correlated.) Why is it, that an amateur like me [in energy analysis] feels the need to do his own computations to figure out such issues rather than just being able to read proper studies online?
Since it appears difficult (certainly outside academic journals) to find detailed numbers on how strongly, for example, wind power actually relies on fossil fuels, I decided to do some estimates myself. I am not primarily interested in cosmetic amounts of wind power production, but will take the ambitious renewable visions seriously and study scenarios where wind power would be enough to power our entire society. I want to understand to what extent electricity production in such scenarios still relies on reliable energy sources and what kind of energy storage is required to enable wind power to stand on its own feet. Since hydropower capacity at a global level is limited, I will mostly use the term “reliable energy source” as an euphemism for fossil fuels. Not to be too parochial and allow for massively distributed generation, I will assume a “super(duper?)grid” coupling wind power sources from three different continents together.
As a starting point I want to create a production profile based on real wind power production data. As sources I choose south-eastern Australia, Ireland, and the Bonneville Power Administration in Oregon, US. Each has roughly comparable amounts of wind power installed, but I will scale the capacity of each to 3333 MWe so that the combined capacity will end up being 10 GWe (peak). Data for BPA and Australia is given every 5 minutes while the Irish data is every 15 min.
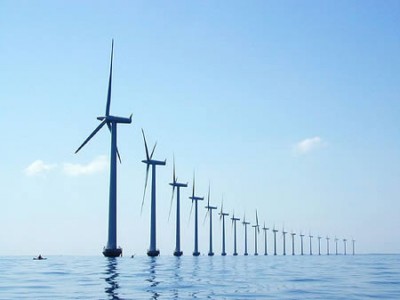
To get the datasets to match I will make a linear interpolation of the Irish data. Furthermore, since my chosen time period for the Australian data (1.8.2010 — 30.7.2011) is a bit different from the other two (1.7.2010 — 30.6.2011), I will fold the Australian data onto itself from the end to generate few missing datapoints. I take the consumption profile from the BPA load, but reserve the right to change its scale to suit my purposes. As a result, I get a combined wind power production from three massive clusters of wind turbines on three different continents. (Note: A slight bias might be caused by increasing capacity over the year.) In Figure 1, I show the power distribution for the individual clusters and for the combined system. The distributions look a bit different to each other, presumably because the Australian turbines are the most distributed geographically. The combined system has about a 7% probability of producing less than 10% of the installed capacity.
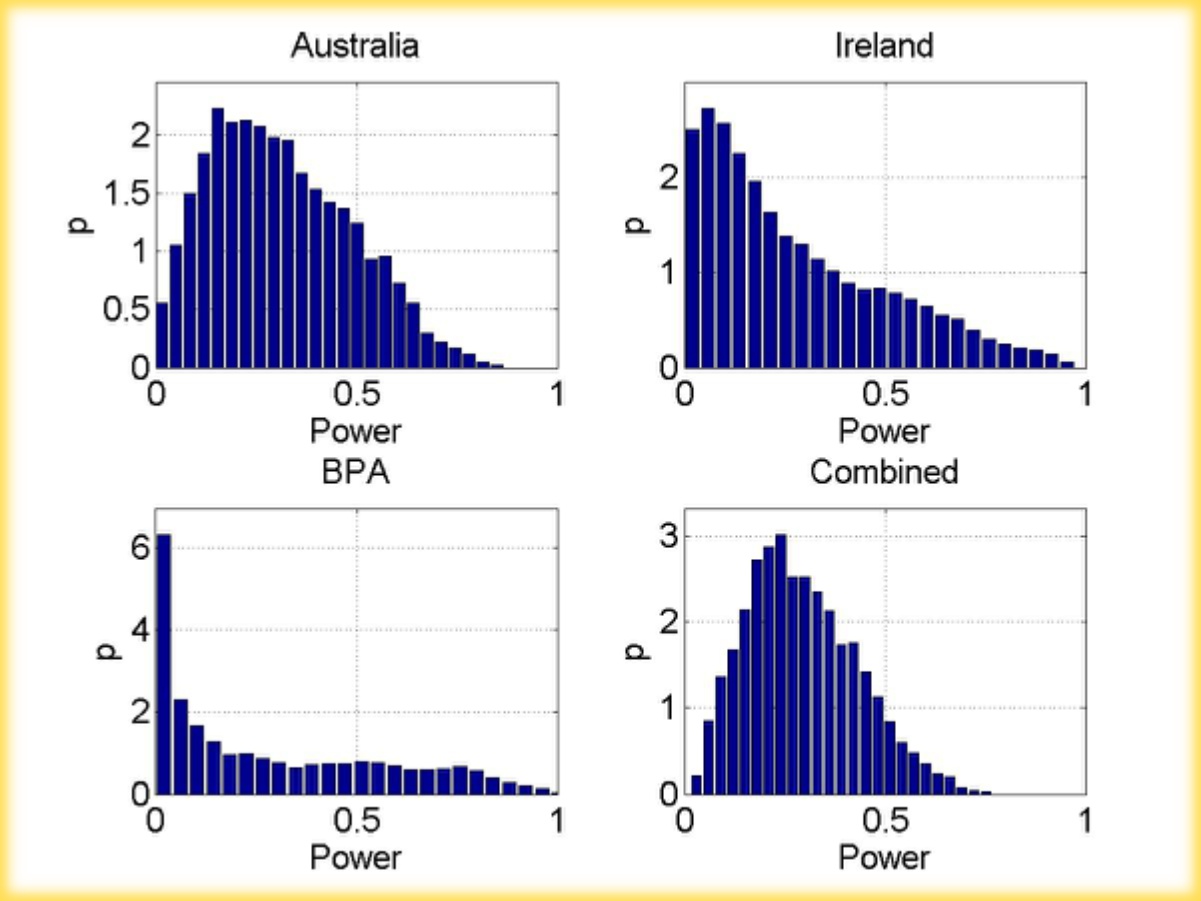
Figure 1: Wind power distribution for different clusters together with the combined system.
Figures 2 and 3 show how production and consumption relate to one another during one randomly picked week in two different scenarios. In the Figure 2, the minimum consumption is the same as the maximum production, so that no wind power has to be wasted. In the Figure 3, the wind power produces the same amount of electricity in a year as the society consumes. Because in neither case does the consumption match the production, some reliable source of energy must bridge the difference. For now I assume that this reliable source of energy can be turned on instantaneously in response to changes in wind production. This assumption is typically wrong and eventually I will make few remarks as to how serious this assumption is.
Figure 2: Maximum wind power is less than the minimum consumption.
For the scenario in Fig. 2 it turns out that 74% of the electricity is produced with fossil fuels and the capacity of the reliable power plants must be 92% of the peak demand. The CO2 reductions in this scenario are nowhere close to what is required and the entire wind capacity has been build to work in tandem with power plants burning fossil fuels. This modest tinkering of electricity supply is quite close to what is being practiced today in many countries.

Figure 3: Wind power production over the year equals the electricity consumption.
In the ambitious scenario presented in Figure 3, some of the wind power ends up wasted and periods of low production must be covered with fossil fuels. It turns out that the capacity factor of wind power drops from around 30% to about 24%. Power plants burning fossil fuels cover about 21% of demand and their installed (standby) capacity must be 88% of peak demand. If we take the threat of climate change seriously, even this rate of emissions is excessive, given that electricity production is not the only source of greenhouse gases and that the global electricity consumption will most likely rise. Importantly, it should also be noted that in this scenario the reliable power plants are running at a capacity factor of only 15%, which increases the cost of their power dramatically. Under this scenario one would quite likely (and perversely) end up paying subsidies to the owners of the power plants burning fossil fuels.
(As an aside, a leaked European Commission document apparently includes a 50% wind scenario by 2050. Based on the above approach this would imply a need for reliable power plants that can account for 92% of the peak demand. Capacity factor for these standby plants would be around 35%. Since solar PV production almost never peaks during the peak demand period and is reliably off during most of the day… CSP with storage might be theoretical possibility, but to be able to contribute to next days peak demand and compensate for the cloudy days they will need substantial storage. Solutions where CSP plants are backed up with fossil fuels are clearly not satisfactory.)
That these scenarios rely fundamentally on fossil fuels does not feel right to someone seriously concerned about climate change. This dependency can be broken if wind power during periods of high production could be stored somewhere. How much storage would be needed? I will now assume that: (i) (only) 20% of the energy is lost during the transfer of wind-generated energy to and from the storage, (ii) storage doesn’t “leak”, (iii) there are no limits on the storage input-output powers, and (iv) that the storage is arbitrarily large. Only type of storage that might approach these conditions even to some extent, appears to be pumped-hydro storage.
In Figure 4 I show how the energy content in the storage varies over the year. I choose the consumption to such a level that the storage at the end of the year is about the same as in the beginning of the year. It turns out that the entire electricity consumption (95% of wind production) could be covered with wind power if the storage amounts to about 9% of the yearly production, or 2.5 million MWh. In practice, about this amount of energy equates to that which would be released when the water from a 90km2 lake that is 20 meters deep drops 500 meters. Naturally this same volume of (fresh) water would also have to be stored at lower elevation to await pumping back into the mountains. However, this scenario appears somewhat unrealistic in that it requires that we can store energy at a power 5.1 GWe and release it at 4.3 GWe. These figures are massive relative to the maximum demand of 4.7 GWe.
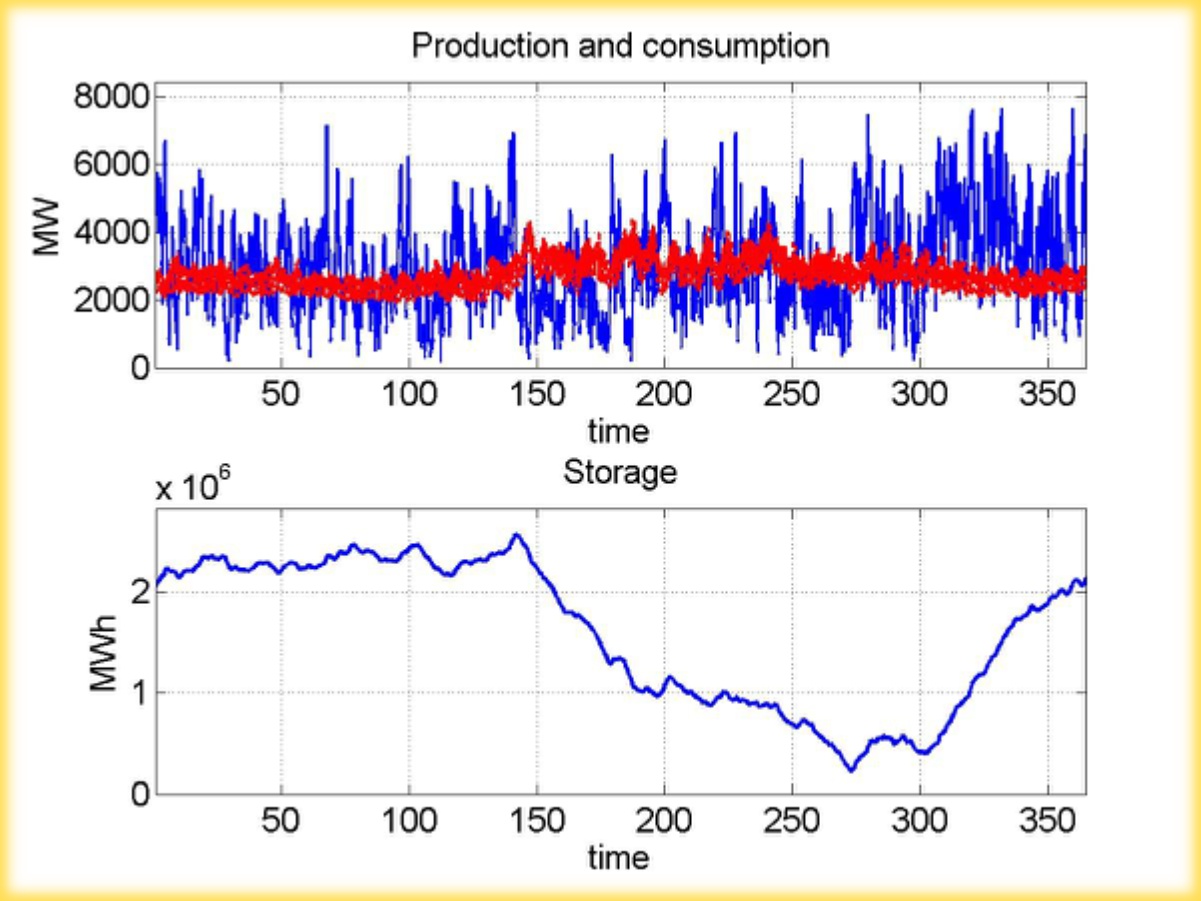
Figure 4: Content of the energy storage over the year.
So let us proceed to make things perhaps a bit more realistic by throttling the storage input-output power to “just” 1 GWe. In this case some of the wind power is again lost and dependence on fossil fuels reappears. Consumption can now be 89% of yearly wind power production and storage must be sufficient for about 5% of production. In this scenario, 4.5% of consumption would be covered by reliable power plants running with a capacity factor of just 5%. However, their installed capacity must still be 63% of peak demand. If we throttle the storage power further, the need for fossils fuels increases.
What if we just store energy for few days? If the storage is for 5 days peak production, and we throttled its power like before, about 9% of consumption must be covered with reliables. Their installed capacity must be 70% of peak demand and the capacity factor is 8%. If we are to remove reliables entirely from the picture, the consumption must drop drastically to the average level of about 900 MWe. Naturally, this implies a drop in the winds capacity factor to less than 9%.
So far I have assumed that reliables can react instantaneously to changes in wind power production. Let us add a delay of 10 — 30 minutes to the scenario of Fig. 3, where most electricity was from wind. i.e., I assume that if the reliable source was turned off, it takes 10 – 30 minutes for it to start producing power again. In Figure 5 I show the resulting difference between production and demand. As is clear from the diagram, even with only 10 minutes delay, more than 600 MWe of mismatch can appear. Smaller discrepancies appear regularly over the year and their frequency increases as the reliables response becomes more sluggish. These observations presumably set some constraints on the amount of reliable power plants which must either be constantly spinning no matter what the wind conditions are, or be able to react very rapidly to changing wind conditions (hydro probably).
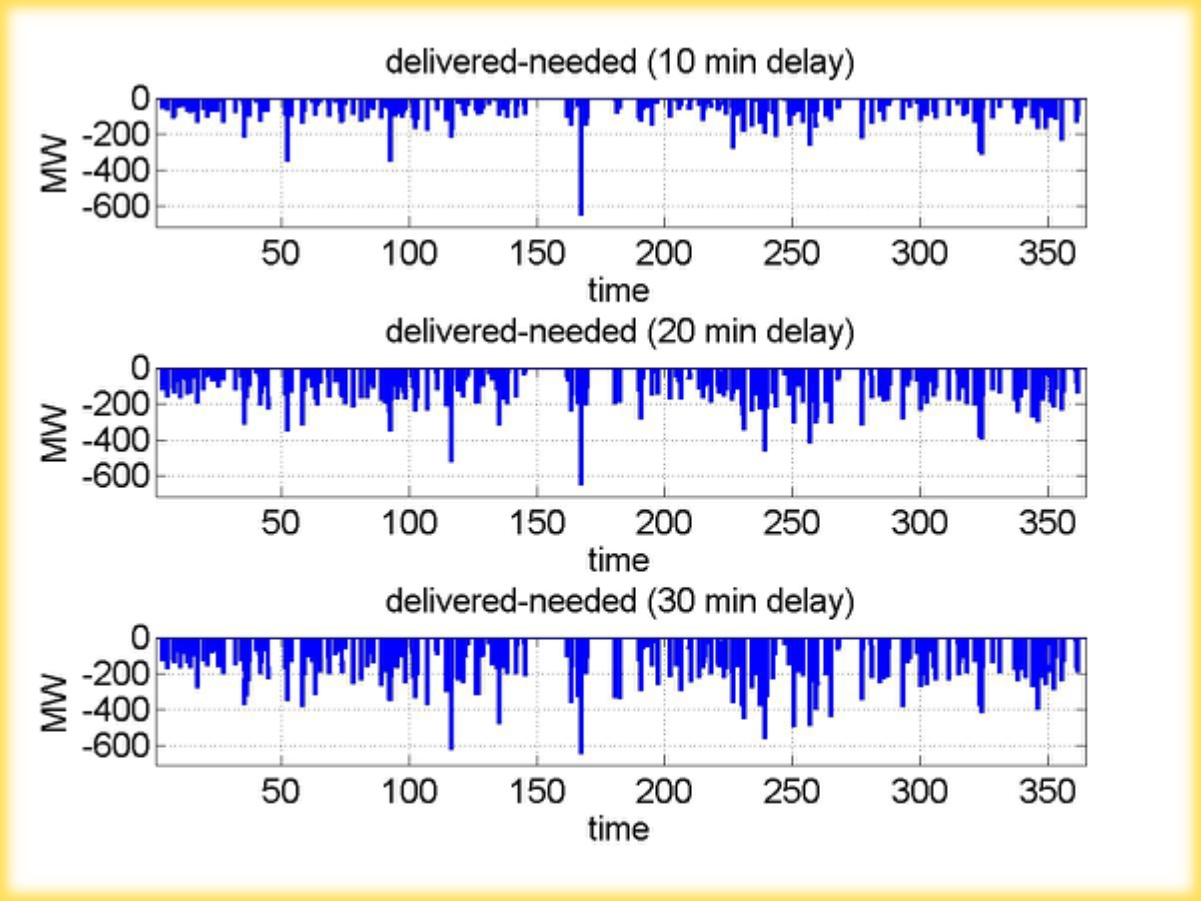
Figure 5: Mismatch between delivered and needed power for few different delays.
It is of interest to check what we actually gain by (hypothetically) combining the time-matched production from Irish, Australian, and BPA productions within a “super grid”. If we only use the production data from Australia for the wind-dominated scenario, 24% of the electricity would come from reliables (c.f. 21% with the “supergrid”) , required reliable capacity would be 92% (vs. 88%), and the reliables capacity factor would be 17% (vs. 15%). Therefore, it seems that distributing wind turbines over an area larger than around 1 million square kilometers (on three continents) provides only modest additional benefits. These benefits should naturally be balanced against the additional costs.
In all the above I have taken the consumption pattern to be fixed. In principle, using smart grids the consumption could change and become more flexible. However, not only does the required change have to be very rapid, but it also has to be potentially a very large fraction of the total demand at certain times. It is naturally partly a political and ideological question as to whether it is desirable to force society to adapt to failures of the chosen technology, rather than demanding that the technology adapts to way people behave. (The way I phrased it, makes it quite clear where I stand.) In fact it is curious how eagerly proponents of, for example, wind power, wish to rely on smart grids even though the most obvious use of smart grids seems to be almost diametrically opposed to their vision! Let me explain.
Sending more detailed pricing signals to consumers, has the potential advantage of lowering peak demand and perhaps inversely increasing night time demand. Under such circumstances, the difference between average and peak demand is reduced and the share of the baseload power actually increases. In the extreme limit case, we would end up with an electricity supply entirely made out of baseload power plants (coal or nuclear typically). Not only would this lower the cost of average kWh, but it would also seem to simplify the design and maintainance of the energy infrastructure. i.e., used in this way, a smart grid seems to be a really smart idea! However, the way proponents of unreliables intend to use smart grids is quite different. For them, the smart grid is a way to lower demand not when demand is necessarily high, but when their favored energy supply is failing. The smart grid is then transformed into a system of managing (avoiding) brownouts, blackouts and load shedding. Used in this way, it is about giving consumers the choice between very costly energy and a blackout. A managed blackout is certainly better than unmanaged one, but how is it exactly better than not having blackouts is unclear.
For the reasons above, I think it is clear that it is very difficult to base the electricity supply on erratic sources of energy. As soon as we start estimating the required storage capacity or the capacity of reliable backup power, we end up with massive figures, implying huge escalations in costs, or an unacceptable reliance on fossil fuels. Getting the production and demand to match each other becomes ever more complicated, and I cannot help myself thinking that the resulting device starts to, more and more, resemble a Rube Goldberg device.
Here is the scenario you end up with: If wind power is too variable, build a supergrid and then connect it to smart grid. Then combine everything to solar power on the other side of continent, which will be smoothed with wave power coupled to geothermal, and as an icing on the cake build large number of microlevel bio, natural gas,and hydro power plants across the continent. If the goal is to create a reliable voltage difference, is there no easier way? If the goal is to redistribute common resources to those who manufacture pieces of the device, however, then there is unarguably some internal logic. Also, if the real goal is to maintain de facto dependence on fossil fuels, this approach is eminently sensible.
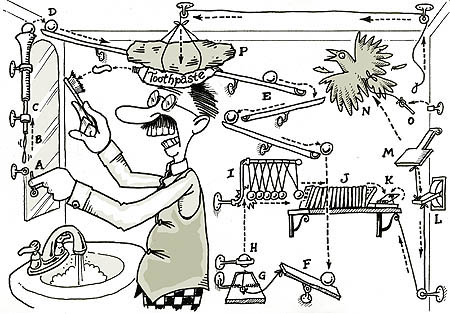
Figure 6: Rube Goldberg device comes in handy when you need to brush your teeth.
Unfortunately, this kind of confusion makes it harder to understand how the whole system works (or doesn’t work) and also harder to understand the final costs and emission levels involved. (Sometimes I get the feeling that proponents for unreliables prefer it that way.) Such visions do not become more convincing when one observes the politics involved. Each part of the device is constructed with scant regard for other parts, with multitude of different national (especially in the European Union) subsidy schemes. Many parts of the device also seem to be more like rhetorical tools, to divert attention from the shortcomings of the activity under spotlight. For example, supergrids are often evoked as a tool that would make huge fluctuations of wind power at national level disappear. As we have seen from this analysis, not only is this assumption unjustified, but it also seems unclear who exactly is supposed to pay for such grids. It is certainly not included in the typical cost estimates for wind power. Also, how are the small nations around Germany, some of which have no need for wind power, supposed to balance the wind power of 80 million Germans? Would Germany pay for the construction of wind turbines in, and transmission cables from, another country? Not likely.
Only scenarios which are based on reliable energy sources from the beginning seem to avoid the problems discussed here. Scenarios based on unreliable sources become progressively harder as their share of electricity supply increase. Reducing GHG emissions sufficiently requires, in practice, total decarbonization of the electricity supply, and the emissions reductions achieved by the time erratic sources run into trouble are far too low. I cannot avoid the conclusion that approaches based on renewables will mainly, at a very large expense, end up delaying the real decisions we must eventually make to lower emissions to acceptable levels. The alternative zero-carbon baseload source seems rather obvious…
Filed under: Emissions, Renewables


Have you considered those following solutions (neither are simple by the way) :
1- Hydrogen production through electrolysis when there is too much wind and solar power. Hydrogen can be use then directly in natural gas power stations (up to a certain percentage) or recombine with CO2 to produce methane and use in both ways gas pipelines to feed plants, private owners (heating) or future gas stations (hydrogen cars, natural gas cars)).
Sounds complex but this is an idea developed by Siemens and IWES in Germany. They plan to build giant electrolysis systems with very low yields (around 30% percent or even less considering heat, purification, de-compression and transfer losses).
2- The importance of electricity storage with cars batteries. Sounds not much but considering extreme assumptions (all European cars are electric connected to a smart grid + super grid) under which they can be used as a big network of distributed storage, why not?
3- You are not considering other way of storing electricity than pumped-hydro. It’s massive and currently it’s the best way to store it. But what about sodium batteries and distributed Li-Ion batteries? Renewables will develop in parallel with other technologies and the future is not written: I’m a supporter of nuclear energy but I’m open to the fact that we can integrate more renewable energies and reducing CO2 emissions at the same time. Small smart grids experiments try to reduce “importations” of electricity from the network and use electricity produced locally, storing it to meet night demand and demand-consumption differences.
4- Have you considered the study from Jacobson from Standford University who produced a peer reviewed paper on the subject applied to USA with few nuclear power and a high share of wind and solar power? Not quite fond of it, but it goes way deeper than the usual GP papers. Several other scientists are working on similar works.
Your post shows how difficult it is to integrate renewable energies (it’s not only a fancy thing from old people who don’t want change their habits as green ideologists so often describe them) and in the same tackling the climate problem while doing it under acceptable economical conditions.
However there is a lot of room to improve electricity consumption. Considering France for example where I live, there is a great work to do around peak demand to reduce fossil fuels consumptions. In doing so we’ll erase most of fossil fuels plants (especially the old ones: coal and oil plants, especially after january 2013 and the beginning of the carbon market for power plants) and hence expanding nuclear share in the mix! As you put it yourself, the final decision will be economical, less than political.
So what’s supposedly good for renewables is firstly good for nuclear: an energy that have a lot of inertia and can’t adapt with quick changes.
Problem with the overoptimistic view of GP and others is that their arguments are build against nuclear power. In the big challenge of climate change, we just need low emissions sources of energy. If we begin to battle against each other, then it’s the third guy in the room who’s going to win: Good Old Coal.
MODERATOR
As a first time commenter you may not be aware that BNC requires references/links to support your assertions on all but the Open Threads. Please read and comply with the Commenting Rules on the About page, when posting.
Good analysis. It has always seemed to me that really the *only* way to make intermittent sources work is to couple them with storage, and your wind/pumped hydro is an example. The wind turbine’s ONLY task should be to pump water uphill, using either direct pumping or a non-grid variable voltage bus. The actual power produced to the grid would come ONLY from the outflow of the reservoir.
This provides the reliable source needed, but of course the significant excess cost of the reservoir and other infrastructure needs to be addressed.
Also, this method is much more difficult (and perhaps unworkable) in flat areas, and regions with freezing winters.
Unreliables and reliables, I love the nomenclature here.
The results from the analysis are quite conclusive: geographic spreading is marginally useful, but has non marginal costs (supergrids, beefed up regular grids). Energy storage in huge amounts will be needed, to truely power the economy with wind. We’ve seen time and time again on this website that this is prohibitively expensive even when using the cheapest forms of energy storage such as pumped hydro.
So in practice, the scenario is pushing unreliables = fossil lock-in.
As a sanity check, this article from The Capacity Factor deals with some of the issues and also links to a study from geographic integration of wind turbines over the North American Atlantic coast:
http://uvdiv.blogspot.com/2010/10/how-to-spin-transmission-line.html
The conclusion is the same there, it helps only a little to bang wind turbines together over large areas. In the words of Uvdiv,
Since we’ve shown that huge energy storage is needed to run on solar and wind, I’d also recommend this article to get a feel on the requirements for the amount of energy storage that will be needed to truely run on wind and solar, in this case for the USA:
http://www.theoildrum.com/node/8237
Here’s the conclusion:
For pumped hydro, 2.5 million MWh would be expensive, at around $100/kWh it would make $250 billion. For a 5 GW grid that is $50/Watt. Even if it is half that it is still $25/Watt. We would never do this, not even if wind and solar cost nothing.
http://bravenewclimate.com/2010/04/05/pumped-hydro-system-cost/
“Strangely, proponents feel comfortable in making such statements, but show a noticeable lack of interest in actually demonstrating whether the statements are true”
I don’t think that is a fair statement, given that Greenpeace have commissioned a study dealing with these questions.
“A North Sea Electricity Grid [R]evolution” (2008), referenced in the report that yo link to.
I don’t claim to know if the results of this study are correct or not (although I would like to know), but I don’t think your statement is fair.
D.
No. Greenpeace makes up and cherry picks limited real data sets to prove a point that exists only in their village mindset.
Greenpeace has never published a single realistic wind integration study. Not one. In fact, they have never published a scientific study at all, ever. They have published lots of grey non-peer reviewed grey literature with lots of pretty pictures, expensive artwork and cool backgrounds in PDF files that are heavy in the megabites and light in intellect and megawatts. There are, however, real scientific studies on this matter, done by real scientists that are not hired guns from Greenpeace.
For example, see the one I linked here where Uvdiv links to a scientific study of wind integration over 3000 miles of atlantic coastline:
http://uvdiv.blogspot.com/2010/10/how-to-spin-transmission-line.html
Also be sure to check out this link:
http://uvdiv.blogspot.com/2010/03/uptime-downtime_07.html
That looks at all wind turbine output of Germany. Lots of geographic spreading. Still totally unreliable wind power.
As you can see in the link, one of the most common webs of lies from Greenpeace and others, is spun around the reliability argument that assumes wind turbines don’t fail all at the same time. This is incorrect; when wind turbines fail, they all fail at once. It is not random as with baseload generators. The problem is not with wind. Turbines are technically reliable. The problem is the wind, not the turbines. The problem is with simple cube power laws inherent to wind that make wind inherently unreliable. Cube power laws seem too complicated to understand for most people. Even overzealous metereologists that really should know better such as Mark Jacobson don’t understand the basics of energy systems. These people are doubly at fault because they really should know better. It is sad, and Greenpeace abuses the public’s ignorance of basic physics and math.
Jani-Petri Martikainen,
This looks like the last nail in the coffin for the argument that “the wind is always blowing somewhere”
I hear Mark Diesendorf has just caught a plane and is heading to Finland (to get you) 🙂
diessoli, on 29 October 2011 at 6:12 AM said:
I don’t think that is a fair statement, given that Greenpeace have commissioned a study dealing with these questions.
“A North Sea Electricity Grid [R]evolution”
It’s not unusual for the entire are West of the Rocky Mountains in the US to have no usable wind. IMHO Hooking together a relatively small group of European countries with a relatively small landmass isn’t going to get them to ‘the wind is always blowing somewhere’.
Australia’s wind farms are spread over an area of 1200 km east-west by 800 km norht-south. From time to time there is a lull over this whole region. For example, for six days in May 2010 all the wind farms produced near zero output. There were 65 5-minute intervals where all wind farms combined were drawing more power from the grid than was being generated.
http://windfarmperformance.info/
Jani-Petri Martikainen,
This is a very interesting and informative post. There is a lot of analysis and information in it. And its very clearly explained. Well done. Here are a few bits that caught my attention and also a question:
1. Finland is the second smartest country in Europe (second only to Luxemburg) according to the figures on the map. 🙂
2.
3.
That gives some perspective to what is needed. In Australia we do not have the topographic relief needed. We don’t even have places where we could have a 100 m vertical spearation between lower and upper reservoirs of the required area each. The required are at 100 m vertical separation would be 450 km2. Actually the vertial spacing qould have to be 140 m to get 100 m drop when the top reservoir is empty and the bottom reservoir is full. All this for just 4.7 GW average power output.
4. In the scenarios with less storage capacity the ‘reliables’ run at a capacity factor of 5% or 9%. This means they will be OCGT, not CCGT. So the LCOE is around $200/MWh [and CO2 emissions intensity little better than new coal]. The LCOE for wind would be around $150/MWh and for the energy storage the cost is very site dependent but would be very high.
5. I’d interpret Figure 5 to mean that more energy storage is required.
6.
That is an excellent example of “limit analysis” ore as some call it “book ending” the problem. Love it. Well done
7. Your comments about smart grids to try to make ‘unreliables’ work makes a good point. “it is about giving consumers the choice between very costly energy and a blackout.”.
8. I see one small weakness in your analysis and you did not explain the reason for it. You point out that the BPA and Ireland data are for 12 months from 1 July 2010 whereas Australia’s data are for 1 year from 1 August 2010. Why did you have the year of data from Australia shifted by one month compared with the year of data from BPA and Ireland? I understand the Australian data is available to cover the same period as you used from BPA and Ireland.
Jani-Petri Martikainen — Well done.
As I have been saying for about 5 years: What the coal companies know that most people don’t:
As long as you keep messing around with wind, solar, geothermal and wave power, the coal industry is safe. There is no way wind, solar, geothermal and wave power can replace coal, and they know it. Hydrogen fusion could, if it worked. Hydrogen fusion has been “hopeful” for half a century so far. I don’t expect that to change any time soon.
If you quit being afraid of nuclear, the coal industry is doomed. Every time you argue in favor of wind, solar, geothermal and wave power, or against nuclear, King Coal is happy. ONLY nuclear power can put coal out of business. Nuclear power HAS put coal out of business in France. France uses 30 year old American technology. So here is the deal: Keep being afraid of all things nuclear and die either when [not if] civilization collapses or when H2S comes out of the ocean and Homo “Sapiens” goes extinct. OR: Get over your paranoia and kick the coal habit and live. Which do you choose? I put quotation marks around “Sapiens” because it is not clear that most “people” have enough brains to avoid extinction when it is clearly predicted and the safe path has been pointed out. Nuclear is the safe path and we have factory built nuclear power plants now. A nuclear power plant can be installed in weeks. See:
http://www.hyperionpowergeneration.com
Hydrogen storage: When the electron of a hydrogen atom is absorbed by the metal wall of the tank, all that is left is a proton. A proton is so small that there is no container for it. The solid wall is only a sponge. Hydrogen leaks out of ANY container. Using the hydrogen to make methane would be a better way to store hydrogen.
Required technology for unreliables: An ambient temperature superconductor so that the whole planet can be connected in one lossless grid.
(Comment deleted.)
MODERATOR
Your comment was off-topic here and violated the citation policy. (see Comments Policy on the About page.)Please re-post on the Open Thread where commenting rules are more relaxed.
@Jani-Petri Martikainen
Did you come up with the idea of branding renewable energy as “unreliable” by yourself, or should you credit Rod Adams, who posted that earlier?
I share with you being an amateur in energy analysis. I don’t share your pessimism.
The way to refute it, in my opinion, is to just build the super grids and large scale renewable infrastructure anyway. Just do it. And show the pessimists that it will work just fine.
K-F Lenz – you may as well say you believe in a supernatural deity because of Pascal’s wager. So who pays to “Just do it”? Not Nike.
@Barry Brook
I would be hard pressed to show who paid the 0.24 trillion dollars invested in renewable energy in 2010 in the couple of lines of a blog comment. But it is obvious that people are just doing it anyway at quite the scale.
I have expanded on the “Just do it” answer to renewable defeatism like that of Dr. Ted Trainer on my blog a couple of days ago here:
http://k.lenz.name/LB/?p=4823
@Rouget: I guess that in principle you could dump the excess wind power to something else. Certainly it doesn’t make any sense to just waste it entirely. However, I am not entirely convinced about costs. Here in the north it has been suggested that the excess would be dumped into heating water, but heating water with wind power is very expensive compared to what it takes to create heat with fossil fuels (or nuclear if that option were on the table somewhere). Also, large fraction of our heat comes from CHP plants and we get it as a by product of electricity. As for car batteries…if we ever have lots of them, I would guess that they would be mostly charged at night increasing the night time demand. Many of them would not be available as backup during periods of peak demand. (Batteries, for now, are hugely expensive way to store energy in massive quantities needed. I haven’t read Jacobson study, but based on comments about him as well as his TED speech, I suspect that I will not be impressed.)
@Peter Lang: Thanks for you feedback. Australian data is from a slightly different time period because of real life constraints caused by the need to change diapers etc. I had already had the routines for handling Australian data before I decided to extend the analysis to BPA and Ireland as well. I suspect that the “error” caused by this is less than the error caused by not adjusting the installed capacity over the year. In principle, one could of course improve on that.
And yes, the term “unreliables” I have picked up from Rod Adams. I think it is wonderful and a descriptive term. “Intermittent” seems to be a marketing word intended to avoid the use of existing words which do not sound so nice.
I agree with Asteroid Miner: the coal industry is not trembling with fright. As we speak in Queensland two coal ports are being built or expanded, Wiggins Island and Balaclava Island. The share prospectus for the privatised Queensland rail system said the coal industry had nothing to fear. If there is meant to be some kind of reduction in CO2 emissions the ever expanding coal industry is not taking any notice.
I also agree with AM that it is better to convert hydrogen to methane so it stores easier and can run in numerous applications such as the 11 million natural gas vehicles. We just have to stop it leaking due to negligent practices. However I note chemists are now working on synfuels that don’t even require elemental hydrogen as intermediate step so long as they can get a 450C heat source; link.
On renewable reliability I speculate that increased cloud cover will reduce PV yields by measurable amounts in the years to come. They can’t even film the Mad Max sequel because the desert turned green several years ago and stayed that way.
(Deleted as off topic and violation of comments policy.)
MODERATOR
Let’s not light the fire Peter.
(The comment to which you refer has been deleted.)
KF- Lenz, Germany has been ‘just doing it’ for decades. It turned out to be a ‘just trying it but failing utterly’.
Physics provides an outer envelope which we must all work with. You suggest to ignore physics. Germany shows what happens when you do this – you lock yourself into fossil indefinately.
This debate is about numbers. It is not about catchy slogans. No numbers, no argument.
@ Cyril R.
Ironically enough, your statement makes a great slogan. Love it!
@ Karl-Friedrich Lenz
I like your enthusiasm, and agree with you that a negative attitude won’t achieve much. But neither will wishful thinking. And I think your leaning a little too far towards the latter. It’s important that optimism has a firm grounding in reality – difficult as that is.
Great article by the way!
Magnificent post, Jani-Petri.
Many of us who regularly visit this site have shared the notion that you have now, with your energy and analysis, demonstrated numerically.
I’m awe-struck at the simplicity and strength of your article, which demonstrates, amongst other things, that frequently it is not necessary to wait endlessly for more data. This is one instance where what is needed is for the available data to be looked at through the lens of logical thinking. More power to you.
Tom Keen, ok fair enough, I hope I don’t sound like a hypocrite but I’ve referenced to some important numbers from The Capacity Factor site already so hopefully you can excuse me for putting in a catchy slogan after that ; )
I’m not sure this adds to a conversation, but Cyril’s “no numbers, no argument” really forced me into posting.
All this is known within the European context (and many others) – the definitive study seems to have been a ‘for profit’ piece by Poyry, an abbreviated release is here: http://www.poyry.com/linked/en/press/NEWSIS.pdf
Around the same time I read this, I read a brief piece, posted on the New York Times’ Green blog, on the brand new book by Amory Lovins.
http://green.blogs.nytimes.com/2011/10/27/fossil-fuels-as-the-whale-oil-of-the-future/
It ends:
“In the interview, Mr. Lovins paraphrased a saying attributed to President Dwight D. Eisenhower: that if a problem seems to have no solution, the best approach is to enlarge it.
For example, he said, if the electricity system finds it challenging to run on energy from the wind and sun, which cannot be scheduled by system controllers, the solution is to combine the electricity and transportation systems, hooking up millions of car batteries that can deliver energy as well as accept it.”
What numbers could possibly counter that argument?
Facts become a call for more unreliables!
Until the savior arrives.
As a car.
Actually that’s easy, most cars will be charged with nighttime off-peak in people’s garages and parking lots so they can drive it during the day. It just so happens that in a nuclear grid, there’s lots of excess nighttime capacity, reliably available, because demand is lower at night and nuclear output is more or less constant. No sunshine at night and wind is not reliably available. You can see how this works here:
http://energyfromthorium.com/forum/viewtopic.php?f=39&t=2813&st=0&sk=t&sd=a&start=15
and here to see that wind isn’t reliably available every night:
http://energyfromthorium.com/forum/viewtopic.php?f=39&t=2813
I’ve also done the basic numbers on what would be needed for the Netherlands as a “good start” plan:
What is interesting is that all the numbers point to constant output being most useful for integrating plugin hybrids, whereas they are useless for more than a day of storage. Oddly enough most of the research being done is with solar – which isn’t there just when people want to charge they car when they get home from work – or wind which is unreliable on a multi day timescale.
@ JM -Game, set and match.
@ Cyril -Would love to see you debate Greenpeace on this issue, and thanks for the ,as always , lucid and clear arguments you bring to the debate
@ K F Lenz Sooo, the EC will “just”build this expensive smart grid after the financial rescue of Greece, Portugal ,Italy etc ? (Sorry moderator, just couldn’t resist that 🙂 )
Scott Luft — Battery schemes for energy storage are rather expen$ive, to put matter mildly. For utility scale storage (underground) pumped hydro is the best currently available and even that is rather dear.
Recent reasearch from a Singapore university hints at the possiblity of a rather inexpensive ultracapacitor. I have doubts that the resistive leakages are low enough to do more than provide another small reactive power service for an electric grid.
However, “no numbers, no debate”; apoliges that I don’t have the numbers readily available.
@Scott Luft
Thank you for the link to the Poyry study. I just read that and found it very interesting.
They confirm the theory that building up grid capacity in Europe won’t have much of an effect, but for a different reason than that in the post above: Their observation of weather patterns show that you need more than 1000 miles of area for balancing wind.
They also try to predict markets. In other words they understand that having less supply on some days will just lead to higher prices in those periods, not a collapse of civilization. It is also of interest to note that the price spike periods are far and in between in their results. Most of the time the problem is not a lack of supply, but a lack of demand, leading to prices near zero.
[…] the Brave New Climate blog, guest blogger Jani-Petri Markainen discusses if large scale grids will help balancing loads in a future with much more renewable […]
Of course 100% of a country, like the Netherlands, to be run on EPRs is impossible without massive offloading of early morning load. EPRs, even without load changing, are not viable for 100% of the generation. You’d need some form of more rapidly changing loading and storage and some form of peaking power. Until we get LFTR and IFRs out the door, it’s not likely to happen. But a cool idea anyway.
David Walters — I’m puzzled as the EPR is advertised as load following at the rate of 5% per minute.
Re David Walters, Cyril R and Netherlands and finding additional off peak loads during mornings.
This case invites a tongue-in-cheek response, based on the fact that the Netherlands already use a huge number of dewatering pumps. These pumps will certainly increase in capacity as sea levels rise: More water and an extra metre to lift it.
Suggestion: Treble or quadruple the total capacity of the pumps and you have partially solved two problems: (1) Preferentially run them during low load periods; and (2) improve security against extreme events by having all that spare capacity.
Unfortunately, the maximum additional capacity of pumps would be tens or hundreds of MW load, nowhere near the several GW (at least) that would be needed to flatten the load curve. I am also ignorant on this subject – the pumps may very well already be used off peak preferentially.
Cyril’s scenarion tends to illustrate the enormity of the batteries/load shifting/peaking problem faced by an inflexible all base load generation scenario and to reinforce the French model as being closer to a real world result. There is nothing to gain from trying to justify an extreme point of view, either of zero unreliables or 100% unreliables, especially if the scenario being proposed ignores the ability of nuclear plant to load-follow, within limits, at very little cost.
Even if the capacity avoided via load following does not result in a cash (fuel) saving, it will avoid the need for greater costs elsewhere to provide additional load. Australia’s NEM is an excellent market model because it is not an energy-only market. It provides market based mechanisms for ancillary services such as frequency control, ramping loads up and down and many other parameters which are essential. There is no reason why the NEM could not adapt existing market mechanisms including load shifting, selective load shedding, pumped storage and many hypothetical others to solve the scheduling issues which Cyril R has attempted to address via car batteries alone. Cyril’s approach tends to suggest that there is only one way to balance off peak loads, and that is via transport batteries. This invites pessimism from those who see that sufficient batteries would be prohibitively expensive and probably beyond this world’s resource limits.
This week has (in NSW) seen broad publicity supporting disabled citizens in our communities, based on the slogan “Don’t Dis my Ability”.
We need to ensure that we do not Dis the very substantial Abilities of any generation option through use of artificially restrictive generation scenarios.
Nord Pool has Norweigian hydro, Danish wind, Swedish NPPs and eventually German wind. The sport price time series is analyzed in
http://www.biblio.liuc.it/liucpap/pdf/200.pdf
which I commend to your attention for the first two graphs (of the spot prices) and then the concluding paragraph.
I found the entire paper of interest, primarily for the analysis of the spot prices in terms of stable distributions; the Nord Pool spot price distribution comes quite close to the theoretical Levy distribution.
I picked car batteries because they are a potential big load and most cars are used daily and would be regularly charged at offpeak times.
If batteries are too expensive and we want to reduce emissions then cars have to go because there’s not enough biofuel potential.
That won’t happen, people really are addicted to driving endlessly with their 2 ton vehicles. I think it’s absurd, but realize that “carification” of society is something we can’t turn around completely. People will pay for the batteries rather than stop driving cars. And realizing that, we might as well try to use the batteries as scheduled load to accomodate our nuclear plants better.
Similarly people want to sit in a building with a comfortable climate. Allmost all of this energy demand is currently met by natural gas here. If we want to stop using natural gas we’ll need an alternative. Heat pumps are a good example. It’s not a big deal to add some hot water tanks as energy storage and effectively use the heat pumps as scheduled demand.
I disagree that it is unreasonable to consider full solutions. The opposite is true. The notion that a little bit of wind, a little bit of solar, energy efficiency, etc. etc. will be enough is wrong and foolish. We have been doing a little bit of this and that for decades. It got us to using more fossil fuels not less. We need a plan that adds up.
Considering we only need a dozen or so large nuclear plants, it seems quite reasonable to me to get started with 90-100% nuclear electric, 50% nuclear electric battery vehicle transport, and 80-90% nuclear electric powered heat pumps for space heating. It will get us a long way to solving the problems. Even then it is not nearly enough, as aircraft, longer distance car travel and shipping hasn’t been dealt with yet.
Karl-Friedrich Lenz, the price spikes reflect scarcity.
The scarcity occurs, often, when it is very cold, or very hot.
Or dinner … or at the start of the workday.
I’m fairly certain this isn’t desirable – although I’ll concede that most could handle the price spikes leveled over a year, the price spikes indicate demand must be curtailed somewhere, and therefore that some can’t handle the price spikes during the cold, or the heat, or …
Regardless, the value of the broader grid is a separate benefit from ‘renewables’, as all jurisdictions would benefit from reduced standby reserve demands. The same is also true of storage.
Tthe scerario, in the post, with wind capacity set to minimum demand (figure 2), is essentially the scenario where renewables are used to displace baseload (ie. nuclear). In my Canadian province, Ontario, annual minimum demand is about 11500MW, and so is nuclear capacity. This post noted, for the wind supply set to annual minimum demand, that “74% of the electricity is produced with fossil fuels and the capacity of the reliable power plants must be 92% of the peak demand.”
Well – I’d argue that adding wind as in this scenario will most likely displace the nuclear, and with that , increase both the need for more generation/storage, and increase emissions.
It’s the same for PV, as you, I assume, are fully aware of. An interesting note on Bavaria, at 8% of supply from PV, having PV output supply all needed power at time: http://www.germanenergyblog.de/?p=7409
Scott Luft, no adding wind means the wind turbines are curtailed. Nuclear power has a lower marginal production cost than wind unless your wind capacity factor is really great (which is nowhere in Germany, with its pathetic average 16% wind turbine capacity factor). As a matter of fact, the nuclear non-capital production cost is mostly fixed: you pay for the fuel contract, you pay for the maintenance contract, and it makes sense to use the nuclear plant whenever possible. But from a purely investment/financial perspective, wind does not get built in the first place as it is a marginal and expensive and unreliable energy source. Marginal and unreliable energy sources such as wind have to cost about 1 cent per kWh or less to be built in a free market. Clearly with lots of subsidies anything can be made financially attractive, as Germany shows.
Evidently the Swiss parliament believes that a combination of PV and pumped storage will replace the current 35% nuclear contribution to electricity supply
http://www.energybulletin.net/stories/2011-10-30/future-energy-and-interconnected-challenges-21st-century
Somehow rooftop solar panels on mid summer days will reverse the normal grid flow and enable billions of litres of water to be pumped up to the mountains, enough to cover the long winters. If they actually believe this the winner must surely be Gazprom. Thus Switzerland joins Scotland, Germany and perhaps Japan in planning to phase out NP.
John Newlands. It’s so sad. Another two decades for those countries will be wasted fooling around with technologies that don’t work such as solar and wind. Another two decades not invested in solutions that work. No matter how much effort we place into looking at the numbers, the governments of these countries cannot be convinced of rational energy policies and in stead continue on with their emotional energy policies. These countries must learn the hard way, through severe energy crisis.
Great post. I love it when simple methods cut through what looks excruciatingly complex. The words “emperor” and “defrocked” come to mind.
This makes no sense, and is not how wind integration is studied or modeled.
You’re missing the impact of wind energy forecasts on reserve capacity margins and resource scheduling. To take the Australian Energy Market Operator (AEMO) as one example, they report a normalized mean absolute error (NMAE) of 8% on a 40 hour ahead forecasting schedule, and less than 3% on a hour ahead schedule (see page 15). This means wind resources are displacing other forms of generation 92% of the time to their forecast amount (on a 40 hour schedule), and that standby reserves (or wind energy curtailment) make up the difference the remaining 8% of the time (and to levels far less than 88% of peak demand). The question remains, what do these numbers look like for very high levels of variable energy generation (and your analysis has not provided this). With 20% of electricity coming from intermittent sources, the costs of integration are typically very low (£3 – £5/MWh, $4.8 – $8/MWh USD), as are reserve capacity requirements (“15 – 20% of installed intermittent capacity,” UK Report, p. vi).
We have a large library on wind integration studies to date (with varying degrees of fineness, scale, and predictability), and are learning more every day. Your article appears to make use of none of them and is very poorly sourced.
@Scott Luft
I agree that the value of the grid is not dependent on the method of generation. The same applies for storage.
Having a large scale grid will, all other things being equal, always help making money from price differences and stabilizing the system. That’s just common sense. The same applies to having a common market for electricity by way of EU regulation.
Having large scale storage will be desirable with nuclear energy as well as with renewable energy. I recall that the world’s first compressed air storage system was built to work with a nuclear plant.
Your link to the Bavarian situation is to a blog I am reading, so yes, I was aware of that. It shows that in many cases the problem is that there is too much electricity available, and that regulation changes are needed to be able to switch renewable off. I mentioned that in my last post as well.
EL, on 31 October 2011 at 7:09 AM said:
i
This makes no sense, and is not how wind integration is studied or modeled. Referring to installed (standby) capacity must be 88% of peak demand.
I think there is confusion as to spinning reserves and required reserves(could be cold reserves).
I.E. In the US Pacific Northwest due to the geographic separation of the wind turbines and actual experience the Reliability Council allows 5% of nameplate as a ‘firm’ resource for purposes of capacity planning. In Texas they allow 8% of nameplate for purposes of capacity planning.
Let’s take Texas. Summer peak load of 70GW, 10GW of wind turbines.
As only 8% of turbines can be counted on in long range planning.
We don’t know what day next summer Texas is going to need 70 GW and we also don’t have any idea how much wind will be blowing on that day. All we know is that due to the geographic separation in Texas at least 8% of the wind turbines be working on that day. It could be 92%.
How much backup needs to be spinning is based on day ahead demand forecast and as you rightly point out, the day ahead and hour ahead forecasts are reasonably accurate.
Cyril R., @ 31 October 2011 at 12:09 AM
Cyrli R, No. That is not what is happening in practice. What is happening in practice is that nuclear power plants have to be curtailed, even shut down, when the wind is blowing, because wind power is “must take” by regulation. I have detailed actual data from Ontario that shows this (it would take me some searching to find it).
Cyril R., @ 31 October 2011 at 6:30 AM
All true. (Deleted personal inference)
We’ve wasted five decades with anti-nuclear, three decades with pro-renewables, and two decades with other beliefs where emotions dominate over rational anslysis. Predominantly it is the same people involved.
Peter L:
John Newlands linked to a longish Swiss article which includes references to nuclear being always lower priority than PV.
Of course, it helps that the Swiss generate close to 20% of their electricity from run-of-river hydro and a further 20% from pumped storage. They see opportunities to further expand pumped storage. The Swiss dream is to become Europe’s Battery, with HVDC links from north to south and east to Spain.
Interestingly, the solar feed-in tariff quoted is about 9 cents US. The article goes into some detail about this being too low and that it is socially responsible and affordable to raise the FiT to achieve the PV+ Hydro dream.
It must be delightful to live in a country where people are happy paying $8.50 for a cup of coffee and inflated rates for electricity, just so that they can feel good.
The rationale usually given for FiT and RECs is that it helps overcome some kind of bias or inbuilt disadvantage. Maybe that disadvantage is the core of the problem (like irregular output) so the subsidy merely throws good money after bad. Note in Australia and I suspect Europe hydro built before the late 20th century (1997 in Australia’s case) is ineligible for any subsidy.
A quota (e.g. 20%) or mandate (e.g. must-take) also has a cash subsidy equivalent as they explain with diagrams in Econ 101. Subsidy advocates in Europe and Australia insist the help is temporary until the scheme is about to expire in which case they usually seem to need an extension. Garnaut, the Productivity Commission and the generators association each said RECs should stop the day carbon tax starts. Surprise surprise the REC scheme was extended so renewables get two bites at the cherry, a subsidy and handicapping the opposition. Some suggest that granite geothermal is not renewable in real time but mining of trapped radioactive heat. No matter it will get RECs (currently 3.9c per kwh) if they ever get it to work.
In some circles it might be considered sacrilegious to ask why nuclear doesn’t get a feed-in tariff. As a warm up question we should ask why 20th century hydro doesn’t get subsidies if it ticks all the boxes like low carbon.
KFL, I think you’ve got it right. How is it we end up with too much supply (also true in my province of Ontario)?
The reason is in feed-in tariffs (FiTs), and other power purchase agreements (PPAs). You noted this on your blog indirecty. Institutional investors love guaranteed rates of return for 20 years – not renewable energy. The value is in the contracts – not in the generation itself.
This leads to too much supply (if you pay more for supply than the market dictates, and provide contracts where the output must be taken whenever available, you get too much supply).
Cyril R., the fuel costs for Ontario’s CANDU reactors are, according to recent benchmarking exercises, about $3/MWh. Which is higher than wind’s nothing, but not by much! Neither would have reason to curtail production, in a free market, outside of negative pricing.
Due to higher non-fuel, fixed, costs, when incentives (FiTs and other PPAs) are added for one and not the other, the results are exactly as Germany demonstrates.
Peter Lang, I have the Ontario data, and developed a model implementing proposed changes to our supply mix out to 2022. Adding 7000MW of wind capacity only reduces the need for peaking sources (presumably natural gas) by about 850MW- which concurs with the system operator’s expected CF contribution at peak. Some nuclear units have steam bypass capabilities. The system operator seems to like using them to curtail surplus generation at night (because they can then ramp the supply up quickly in the morning). For the same reason, allowing water to flow over the falls, instead of diverting it through the turbines, is the most operationally sensible curtailment.
Regardless of which method is chosen, by 2014 I forecast 40% of Ontario’s wind generation will require dumping on export markets, or curtailment either in Industrial Wind Turbine output (suppliers are, due to contracts, paid regardless), or, more likely, elsewhere in the supply chain.
@ John Newlands,
that biofuel deoxygenation process you linked to was interesting. However, the one thing I’m always concerned about is scale. People read articles like that one and just immediately assumes it will save them. “biowastes = oil, we’re saved”. Without running the numbers on how much biowaste we’d need to replace oil.
Also, is this the best way to do it? Tom Blee’s plasma burner chapter really impressed me. It extracts all the potential synfuels from waste hydrocarbons in everything from rotten wood, disposable nappies, asbestos, pizza boxes, and even human bodies if we decided to run Crematoriums like that. 😉 Then there’s the side benefit that the plasma burner means there is no landfill, and plenty of building products by spinning the waste slag into rock wool while it’s hot.
And that’s just from an energy and resources point of view. Then there’s the fertiliser aspects I’m also concerned about. EG: If instead of chucking all our lawn clippings and food scraps into the garbage to be ripped into synfuel at the local plasma burner, we could instead continue to separate them into our council green bins. Then instead of just composting this stuff, the councils might shred and brew it up in a Kompogas system to generate some methane… AND FERTILISER. The plamsa burners would continue to generate synfuel and building materials but from a decreased stock of hydrocarbons.
Your thoughts?
I’ll show some generosity of spirit and tell you about one more method of “storing excess electricity”. The butter and cheese mountains and frozen beef and pork that the EC farmers produce are stored in giant refrigerated warehouses. Now , when there is an excess of windpower or what have you ,you can run the compressors until the temperature inside your beef mountain is ,say -40 degrees. You can then safely turn off the plant until the temp reaches -12 degrees , which gives you quite some time during low power availability. ( Cannot quote any figures for this yet, but it was discussed on some radioprogram as a means of load levelling) Apparently these warehouses are enormous, and as such they use and store a lot of energy.
@Scott Luft
Supply exceeding demand for electricity is not necessarily “too much”.
I would like to have a fleet of nuclear power stations producing hydrogen or some other fuel for transport, and water by desalination for irrigation all day long, joined by the overcapacity from wind and sun. Providing electricity exactly matching demand would be only a side business in my ideal world.
In my view, the goal is not getting 100 percent of electricity demand all the time, but 100 percent of all energy demand over carbon neutral generation. With that in mind, there can be no such thing as too much energy.
It is interesting though to note that the old nuclear slogan “too cheap to meter” finally becomes true some of the time. We actually get negative prices!
This might also be a good time to mention that Enertrag just opened the world wide first hybrid wind power plant that uses excess wind energy to produce hydrogen, enabling them to follow the demand curve exactly by burning the hydrogen later in a gas turbine.
http://k.lenz.name/LB/?p=4871
unclepete: The principle may be worth thinking about, but the methane cost of producing a butter and cheese mountain will hardly make it carbon neutral.
EN I agree that the ‘leftovers’ from any synfuel process should be returned to the fields and that the synfuel should easily power the harvesters and trucks. Then there has to be a large surplus for the rest of society.
As far as I am aware the plasma gasification approach has not achieved this yet. Same goes for biogas as there is only so much slime to go around. There would be less fugitive methane if it is extracted at landfills and sewage farms, not stinky and inefficient home based digesters. I’ve experimented with both biogas and synthetic methane and I can see the scaling problems will be formidable. I’ve independently come to the same conclusion of at least one other BNC commenter … we should save plenty of natural gas for later.
Natgas and CSG have had hundreds of millions of years to brew underground. Now h. saps has arrived late on the scene and like a spoiled kid wants everything now. I suspect there is no cheap and convenient realtime replacement for hydrocarbons like oil and gas. At the very least we should not be burning gas for baseload power. I think we should give ourselves til 2050 to solve the affordable synfuel problem. Perhaps we won’t.
On issues like phosphate depletion I think we’ll have to grow food in the suburbs fertilised with ‘night soil’. Not helping will be weather twice as extreme as we have now.
True enough! The author of this guest post does not appear to apply this methodology to determining the capacity credit of wind in his projected models for Australia, Ireland and BPA. These are based on loss-of-load probability studies (used in long range capacity planning), and are described here for ERCOT (and why they have it set at 8.7% for long term planning). The author appears to make a rather serious error mistaking the capacity factor for wind (in real-time performance data) with wind’s effective load carrying capability or capacity credit (central to long term planning). For a more complete explanation of this, you can look here, and find a documentation of capacity planning credits in the range of 8 – 30% for a number of jurisdictions in the States. The question remains, what is the impact on balancing requirements, grid improvements, operating reserves, and storage alternatives for energy systems with greater than 30% or 50% or 70% contribution from variable sources? An important question, no doubt. “Using 2004 as a base year,” one study for the Minnesota Public Utilities Commission “found that a 25% wind penetration level would only require an increase in reserve requirements from 5% to 7.05%” (p. 17), and at relatively low capacity values for wind (5 – 20%). The author of this blog post appears to have taken a very unconventional approach to the issue (duplicated in few other studies), or has seriously confused his terms. I’m having a hard time matching it to other studies on wind integration (which are quite extensive at this point), and thus fully appreciating it’s relevance.
Wind in Texas is substantially de-correlated to the load, so in practice (on this system) it likely has a slightly negative capacity credit.
http://uvdiv.blogspot.com/2011/08/texas-electric-grid-declares-level-1.html
Electric demand in Texas is surprisingly constant, varying within 35-65 GW.
EL, why is the result here different from other studies? Simple, because this study looks at how to power the country with wind rather than using a 10-20% wind portion to greenwash an 80% fossil grid lock-in.
I have made this point repeatedly. Before staring yourself blindly on some percentages, it may be a good idea to zoom out and ask yourself what your goal is. My goal is to phase out fossil fuels. This excludes the 20% wind 80% fossil grid system.
The fact that this is considered ‘unconventional’ totally flabbergasts me. As an engineer I’m paid to solve problems 100% not 20%. For some reason not solving a problem 80% is considered fine for wind integration analysts. They need to zoom out too.
It’s not purely an engineering problem, but a social problem (what technologies are attractive), a financing problem (what time frames are we talking about), an insurance problem (who covers the risk), an environmental problem (dealing with pollution, waste, and diminishing land, water, and fuel resources), a global security problem (energy independence and security risks), a global development problem (what works just as well off-the-grid in developing countries as on-the-grid), an entry barrier problem (who has the human resource capacity and regulatory expertise to pursue different energy alternatives), a manufacturing problem (how complex and scalable is the technology), an energy use problem (are we only focused on low cost consumption, or conservation too), and most likely a great deal more. So yes, we have many levels to look at the issue, and it seems the engineering basis (limited to current technology) still seems relatively narrow and located close to the ground to me. More than half of the energy we produced since the industrial revolution we have consumed over the last 20 years (with emissions rising each step of the way). We’re not going to get to where we want to go by doing more of the same.
@ EL:
I fail to see how EL’s last post addresses the issues, which are that unreliable/stochastic/intermittent sources of electrical energy are expensive, do not represent a pathway to reduced CO2 emissions and when forced into baseload applications become a waste of time and effort; a distraction from both the utilitarian’s aim of provision of reliable energy and the concerned bystander’s aim of preserving planet earth for future generations.
Waffle about insurances, “attractive technologies”, and a long list beyond these is nothing but a smokescreen, an obfuscation and a nonsense.
I care not at all that EL, in words posted at 5:13 this morning is “having a hard time matching it to other studies on wind integration”. For that matter, I am having difficulty establishing the relevance of much of what EL has presented.
What I am left with, though, is delight that the author of the lead article has taken the time to prepare such a lucid explanation of the real issues faced by those who seek to dream of 100% renewables.
EL,
In the US PNW the capacity planning credit is 5%.
In other jurisdictions such as PJM the capacity is ‘assumed’ at 20%-30% then adjusted as actual data becomes available. PJM assumed 20% and it has been adjusted downwards to 13%.
And here is a whiti paper from the NY ISO
http://www.nyiso.com/public/webdocs/documents/white_papers
/wind_management_whitepaper_11202008.pdf
emphasis mine.
A lot of factors go into determining the siting of wind turbines. Wind developers obviously want to place them where they will produce the maximum number of KWh, transmission costs are cheapest, near roads that can carry the construction equipment and interference with other land uses are minimal. That means they end up with ‘less then optimal’ geographic distribution.
Most of the comments above are true. West Texas wind does not correlate well with the ERCOT peak demand and that is basically why wind has the low 8.7% of installed wind capacity credit in ERCOT. However Texas coastal wind correlates well with the daily system peak so the effective load carrying capability of coastal wind should be much better than 8.7%. ERCOT has an RFP on the street now wanting to hire a consultant to help them with calculating the effective load carrying capability of wind and solar at various locations on the grid. I am working on a proposal for them. I looked up the original definition of the ELCC in a 1966 IEEE paper by LL Garver at GE. He said that you could start with a base case with a load level set so that the loss of load expectation is one day in ten years. Then add a new generator to the system and rerun the LOLP study with the new generator and adjust the load level upward until the LOLE is again one day in ten years. The difference in the MW load levels is the effective load carrying capacity of the new generator. To me this makes perfectly good sense. We try to design the system so that the overall reliability is one day in ten years. It doesn’t matter what kind of generation we choose. However some generators will work better at serving load than others. Generators with a high forced outage rate will have a rather low effective load carrying capability. Say, do you guys down there in AU need an LOLP study calculating the ELCC of wind? I should send in a study proposal to your system engineering planners.
Maybe that’s because their political masters who pay the subsidies want Sunday afternoon drivers to feel warm and fuzzy when they drive past. The public fails to notice the gas fired power stations in the industrial suburbs that make the wind farms possible.
The capacity credit for the eastern Australian grid — one of the most dispersed in the world — is 3 to 8% according to Australia’s Energy Market Operator:
http://bravenewclimate.com/2010/05/22/tcase10/#comment-68433
This accords with the figures cited by harrywr2, not the theoretical values given by EL.
[…] laskennallisesta potentiaalista päästövähennyksiin (samainen artikkeli on englanniksi myös BraveNewClimatessa). Jaa:SähköpostitseTulostaFacebookDiggTykkää tästä:TykkääOle ensimmäinen, joka tykkää […]
One side issue on the viability of wind which does not draw much attention, especially in the necessary detail is the amount of rare earths that will be required to construct the number of turbines to generate the estimations in the above analysis. The only real analysis I have seen is on this blog post:
http://bastionofreason.blogspot.com/2011/03/planning-future-of-energy-with-rare.html
The post also seems to challenge the idea that a large electrical car fleet can provide a means of storage backup to a large wind infrastructure. So that would eliminate Rouget’s second idea (first comment) which seems to be shared by many wind proponents. Tie that loss to the lack of economically viable storage options stated in this post and what argument does a wind proponent have left to drive the expansion of further wind development over other alternatives?
Following.
Only about 5% of the world’s production of rare earth’s are used for permanent magnets (including neodymium used in wind turbine generators). The remaining 95% are used in consumer electronics, TV displays, medical imaging, batteries, CDs/DVDs, glass and ceramics industry, oxygen sensors, engines, petroleum refining, and nuclear industry (“rare earth elements are used in the nuclear industry in control rods, as dilutants, and in shielding, detectors and counters”). The industrial waste stream is likely to become a very important source of rare earths in the future, and re-starting mines in the US and Canada (which were unable to maintain a completive advantage vis a vis low cost mining in China).
EL, while only about 5% of rare earth production is used for magnets, that 5% might include nearly all of our neodymium production.
There are 17 rare earth metals. Saying only 5% of rare earth production goes to permanent magnets misses the point. Only neodymium and samarium are used for magnets. So 5% of rare earth production might be nearly all the production of these two metals – their applications outside of magnets are quite limited. The other applications you list are largely served by different rare earth elements.
So the supply bottleneck Louis implies remain valid for wind power, and in general for replacement of internal combustion engines by electric motors in a mass electrification scenario for decarbonization. This latter cuts equally against a nuclear electrification scenario as for wind. But unlike wind, nuclear does not consume massive amounts of rare earth elements in electricity production.
If you’re looking to cut down on weight, you’re looking to low cost neodymium. It’s the most widely used magnet in hard disks, guitar pickups, headphones, bearings, cordless tools, jewelry clasps, power steering motors, parachute mechanisms (to name a few of it’s many uses). Sony has been using it in their consumer products for the last 10 years. Supply chains are tight, it’s among the most abundant of the rare earths, and it may not be needed in wind turbines (in a 30% neodymium, iron, and boron sintered magnet). Scarcity appears to be the mother of invention, and ARPA-e is dabbling in alternatives. There are lots of eager companies hoping to mine the stuff, but matching the low cost of China remains the most significant hurdle (and the prospect of switching our entire vehicle fleet to hybrid or EV autos). Wind turbine generators appear safe for now.
An intriguing possible connection between REEs and nuclear is Arafura’s proposed plant at Whyalla
http://www.adelaidenow.com.au/business/sa-business-journal/arafura-buys-800ha-in-whyalla-from-onesteel-for-its-rare-earths-plant/story-e6fredel-1226085680406
Elsewhere they claim that the REEs are the ones in demand. The plant is expected to produce some U3O8 and 20,000 tonnes a year of thorium oxide. Note Whyalla is where BHP wants to build a desal and 320km pipeline to Olympic Dam. Flowing water is not Whyalla’s strong point however.
There’s more. The OD tailings contain plenty of REEs mainly lanthanum I believe. They are left on the ground as currently uneconomic to process. At Ceduna to the west zircon sands containing monazite will be shipped to Geraldton WA. There monazite will be separated and perhaps treated in Malaysia to get REEs and thorium.
If they can find a mystery power source to enable the OD expansion I wonder if thorium could be used. At full tilt OD will generate 19,000t of U3O8 but the Arafura plant will generate 20,000t of ThO2 per year.
@ EL, re neodymium:
1. The “low cost neodymium” magnets are the same stuff you and John Morgan were both discussing. The word “Neodymium” is used specifically as the name of the reare earth metal and colloquially as the magnetic product Nd2Fe14B.
See: “…[R]eference to neodymium-iron-magnet alloy not neodymium alone.” in the article cited by Loius. Did EL read it??
2. That ARPA-E has recognised the problem and is now searching for a solution to it is indicated by the article cited by EL. This is not to be confused as suggesting that the problem has been solved; to the contrary, EL has demonstrated that the problem has certainly not been solved. Scarcity may well be the mother of invention, but in this case, scarcity remains.
John Morgan’s comments stand.
Yes, China has a tight hold on rare earths (at one point producing 97% of global supply), put in place an embargo on exports now lasting two years, and production is just starting to pick up speed from other sources (here, here, and here). Commodity prices reached their high this summer, and have fallen by some 30% to around USD $260-270 kg. Enercon has a gearless turbine design that uses an electrical excitation generator, and not permanent magnets. China likewise has a prototype design they hope to put into production in 2012 (thus avoiding the issue of rare earths all together). I don’t see this as being a game changing problem, in either the short or long run (for wind turbines, at least). And yes, I did read the article recommended by Louis.
EL, Why do you always seem to change the subject?
I made two observations.
1. I explained why you were confused about the use of the word neodymium, and that both meanings were explained in the original citation.
2. I pointed out that your own reference posted in support of a claim that the neodimium shortage had been overcome actually said no such thing.
Now, you have responded with irrelevant stuff about market prices at the current level of demand. The point remains, that at anything like the suggested USA wind turbine build to generate sufficient energy to match the existing FF generation fleet, neodymium will run out. Finit. All gone.
Your response is to the effect that somewhere in China is a suggestion of a hint that something better might come along some day maybe.
I’m not going to be convinced until it arrives.
Using current technology, the promise of wind, even regarding gross energy, regardless of transmission and energy storage constraints, cannot be delivered because to do so would require more than the whole world’s supply of neodimium metal and part of neodimium (alloy) magnets, just for USA. That was the claim upon which this discussion was founded, and that is certainly still the case today.
Tomorrow is another day.
Tomorrow, if the technology develops somewhat, neodumium may no longer be a show stopper.
When that tomorrow comes, the situation re wind turbines may change.
Till then, that particular means of retiring existing baseload will remain an impossible dream, and that ain’t maybe, as the saying goes.
I’m not confused about the word neodymium. My original post to John Morgan includes the comment “30% neodymium, iron, and boron sintered magnet,” which you properly pointed out is Nd2Fe14B.
Why is it that you persist? Enercon is the 5th largest wind turbine manufacturer in the world with 7.2% share of the global market. They pioneered the direct drive generator (which has very low maintenance costs and a long service life), and all of their turbines use a wound field rotor (with no permanent magnets). That means zero REEs. NIB magnets are favored in many current designs because of their light weight and slightly better energy yield (3% according to this source). Enercon claims its wound field annular generator gives it better control over magnetic field, and can be switched off when not needed. There are known trade-offs to the different approaches, and rising neodymium commodity prices may swing the pendulum in the direction of Enercon (and Chinese developers who are following their lead).
The USGS has also done an inventory of rare earth reserves in the US, and found them “Not So Rare.” China has 95% of the global production, but only 37% of the proven reserves. The US has 13 million metric tons of REEs within known deposits … Canada, Australia, India, and Brazil with a large portion of the remaining share.
Anybody want to talk evolution to HTS superconducting wire as a breakthrough technology for wind? Yes, this likely means more REEs (this time yttrium) for higher energy yields, performance, and even energy storage … but some discussions lead to unanticipated outcomes. Can we move on from this topic yet? A bit more on what this looks like (and efforts to realize a 10 fold decrease in wire costs).
@ EL:
In response to the question as to why I persist, and in a spirit of trying to comply with the rules of this blog, I offer the following.
Any exasperation I displayed in my recent posts about scarcity or otherwise of neodimium arose because, as an engineer, I place a very low value on speculative sales-speak from obviously partisan sources and a high value on demonstrated technologies which are able to be deployed in a timely and affordable manner.
To keep things simple, I prefer to address topics one at a time. I can, at times, become frustrated when confronted by attempts to detour away from the subject under discussion, especially if those sidetracks are supported only by speculation or sales guff, when what I seek is answers based on either interpretation of the information before me or substantiated and relevant additional information.
So, I am willing to abandon my attempt to obtain clarity about the current limits which constrained neodimium supplies – both as the element and the alloy of the same colloquial name – place on manufacture and deployment of wind turbines using current designs.
I am not, however, prepared to say that any confirmable new information presented thus far has demonstrated the practical liklihood of sufficient neodimium (element) being found, mined, smelted and marketed in time for deployment of a sufficient number of wind turbines to provide enough energy to displace current baseload electricity generation in USA, which is principally coal and nuclear.
No new information has come to light to demonstrate that commercial designs of wind turbines are available which could achieve the same goal but with substantially reduced or nil neodimium.
Last, it is beholden on those who make claims about the capacity of wind-power or any other technology’s capacity, constructability, availability, cost or performance to base these claims on real data, not projections of hoped-for future ambitions.
So, my contention, and that of others, remains that supplies of this not-so-rare-earth element are currently constrained and this absolutely represents a limit to deployment.
Tomorrow’s technologies may be different, but that remains to be seen.
So please, EL, I know that you mean well. Have the last say, since that is what you have requested. Perhaps you know of a commercially available turbine design out there which demonstrates that this constraint has been overcome.
Thank you for your considerate reply, and I can clearly see that you mean well too. Even if we argue, I think there is plenty of good information that comes out as a result. We’re writing blog comments, so it does not always come out in “publishable” or “journal article” form, and I expect that for both of us there is some learning that takes place along the way (when new information comes to our attention). This is what I find exciting and hopeful in a setting like this, that people can work out their ideas, learn from others, and have their statements challenged in a constructive and thoughtful way (as an evolving work in progress). Maybe others prefer a more finished form of conversation, but I don’t think this is how science or knowledge gets created, everything is open for risk, assessment, evaluation, and debate (there are no “sacred cows” in open and rational debate, and I don’t leave out an important role for subjective interpretations to lead to important new questions being asked and new discoveries being reached). Science and objective knowledge is imaginative just as much as it is factual (I think Einstein, and many others, would agree to as much).
I agree with you, there are supply constraints with neodymium (and other REEs), China is extorting and standing in the way of competitive development opportunities (by dramatically curtailing global supply), and that if we continue down the path of direct drive PM turbines (at a scale of some 1000 times the current production level) and develop a parallel path for hybrid and EV autos (that change the way we approach transportation), grid battery storage technologies (that make a real impact), superconducting transmission and generators (to move and store energy at high power and low losses), and a great deal more on the future technology wish list, we’re going to be running up against some serious challenges. But we aren’t there yet, we’re not even close, and NIB magnets are not the only game in town. You should look at some of the links I posted above: on USGS estimates on known deposits, the industrial waste stream for REEs, US and Canadian mines getting ready for production (there are numerous others), and the rapid response of auto industry to recent supply chain interruptions (contributing to rapid demand destruction, and getting off REEs). I’ve said the same for the wind industry too … have you looked at Enercon (and other makers) pioneering competitive “direct drive” turbine designs that don’t use permanent magnets! The Enercon E-40 turbine is regarded as “the most visible turbine in Europe,” and they currently have the largest turbine on the market (the E-126 at a whopping 7.58 MW output).
With all do respect, if you can produce competitive energy with wind using no REEs (and meet many of the most advanced and current performance objectives), doesn’t that solve the problem? I’m not sure how much more obvious I can get than that! A wound field rotor generator design may not be the best choice for offshore applications, where weight is going to be a consideration, but perhaps this is where superconductors step in, or other magnetic circuit topologies (as this editorial source seems to imply). I don’t think these problems are unsolvable … in fact, I’m sure we’ll have our answer soon enough (especially if neodymium prices decide to take a flying leap off the proverbial cliff, which they are not promising to do anytime soon).
I’m not drawn to simplistic single sentence reductions of complex information (energy technologies are far too complex and full of trade-offs for that). Perhaps that has contributed to your “frustration” and “exasperation” as you describe?
Thank you, EL.
The short answer to my question is that the E-126 is commercially available, several are in service and they require no neodimium magnets, plus a link to a site confirmiong this, which you have now provided.
jani-Petri
The distributions look a bit different to each other, presumably because the Australian turbines are the most distributed geographically. The combined system has about a 7% probability of producing less than 10% of the installed capacity.
This has to be a “slight” understatement. The distributions are totally different. Ireland is a relatively small geographical area(about 1% the size of Australia or US), so its understandable that there is a high probability of low output. It looks like BPA has a either a seasonal or daily zero wind period. In fact combining the 3 independent regions doesnt look much better than the SE of Australia, where about 50% of the wind capacity is installed in a relatively small geographic region( eastern SA, and western VIC).
OZ-energy website gives the simulation using 30 widely separated regions of Australia based on wind velocity data. From memory output is generally between 18-60% of installed capacity. This seems very different from your results of combining 3 widely separated regions.
http://www.oz-energy-analysis.org (Link fixed)
In reality future electricity is going to be generated from a range of different renewables, using the considerable existing hydro storage as well as pumped hydro storage and possibly some load management using electric vehicle charging with some peak demand continuing to be supplied by rapid response gas fired generation.
Neil Howes — (1) Your link is broken for me. (Link now fixed) (2) Despite the claimed 18-60% one still has to determine the capacity credit for the resource. Wind in the USA runs from a low 3% to a high 8% of nameplate capacity; here in the Pacific Northwest, while Colombia Basin wind is nominally 30% of nameplate and producers realize ~26% of nameplate , the capacity credit is but 5%. Therefore excess generation from other sources is required to meet the reliability goal.
@Neil Howes: Thanks for your comment. The site you linked to is interesting. One can certainly improve on the datasources I used, but unfortunately not everyone is obliged to provide the real world data to the public. Also, note that the windspeed data in the site you linked into are, I think, at 1 hour intervals. There are things happening also at shorter time intervals (as I pointed out). The longer one chooses the averaging period less fluctuations one has. At one extreme you could take a yearly average and conclude that there are very little fluctuations. This is very clear btw. in the data for solar PV. BNC linked into a study recently which found massive short term fluctuations in solar PV output. If one would have taken on hourly average, most of that fluctuation would have disappeared. So it is important to use as detailed data as possible.
It appears there was a similar study in denmark:
http://pfbach.dk/firma_pfb/newpower_windfeature_issue14_2010.pdf
MODERATOR
BNC Citation Policy requires more personal analysis of any ref/link you post. See the About page before posting again. Further violations may b deleted.
Do you have reference for 5% capacity credit in Pacific Northwest?
The reference I provided above (2008), which nobody appears to have read, cites the capacity credit for wind in many jurisdictions in the US.
PMJ – 13%
New York ISO – 10% (summer) and 30% (winter)
Southwest Power Pool – 10%
PacifiCorp – 20%
ERCOT – 8.7%
Nebraska Public Power District – 17%
Idaho Power – 5%
Pacific Northwest (Northwest Resource Adequacy Forum): 15%
Tri-State – 2% – 12% (May – August lower than other months)
Colorado PUC/Xcel Energy – 12.2%
EL — FERC sets the allowed capacity credit and clearly fails to be impressed by NREL’s high claims. The 5% figure for BPA is from harrywr2, maybe earlier on this thread on maybe another. Anyway, I’m sure you can find it somewhere on the BPA web pages.
To claim 15% of NRAF area is just plain wrong. To claim 20% for PacificCorp is completely wrong as the wind down there doesn’t have a CF (mostly) of (much) more than that. I have a hard time crediting the figure of Idaho Power [who will be quite relieved when the Boardman-Hemmingway intertie is completed, bringing them a sorely needed 450 MW from BPA. Foo, Idaho Power recently wrote to the Idaho Utility Commission requesting the commission to not require Idaho Power to take on more wind farms as the last 30 MW nmeplate exhausted their ability to act as balancing agent at all times.
Sorry, but I want actual conservative capacity credits, not NREL’s pie-in-the-sky-while-you-fry.
Yes, and herein lies the rub … we’re not talking capacity factors but effective load carrying capacity (based on wind capacity, time interval, and load variability probabilities, and LOLP base cases for a loss of load of one day in ten years, as described above). This is why I have suggested the methodology for calculating system wide impacts and wind integration in this guest post is unconventional, and is not consistent with resource planning methodologies used by utilities or in current wind integration and reserve capacity planning.
PacificCorp may have a more recent update, but they still post 20% capacity credit (p. 173) on their website. Other regions similarly post ELCCs in range of 5-34% (which is much higher than the 3-8% figure you reference above). The 5% figure at BPA referenced by harrywr2 I believe is WECC standard for operating reserves (and not capacity planning and having adequate resources on hand for integrating wind variability).
EL — I have now learned that ‘capacity credit’ has more than one meaning in the power industry. How annoying.
Yes, I meant allowance for operating reserves, not the extent of backup for wind. The latter is, of course, typically much higher than the former.
However, regarding the essay by Jani-Petri Martikainen heading this thread, I found it creditably done and mentioned so previously. You are, of course, welcome to do a similar study to discover for yourself just how much (fossil fueled, typically) alternate gneration must be supplied in a grid reliant largely upon wind without storage.
@EL: The estimate for the capacity of required reliable power sources derives only from the difference between demand for power and the supply of wind power. Both were derived from the real world data. So there is no monkey business anywhere that I can see. The typical wind integration studies I have seen assume only small wind penetrations and obviously if wind is a small piece in the total system, you have some wiggle room. For example,you can state that actually this particular gas power plant is not needed for wind, since it is needed by coal and then account for wind only whatever excess amount needed. (To me this looks like phony accounting since even in these system wind relies on that infrastructure in the background. For this not to be the case, you need storage and/or consumers whose consumption varies with wind production.) The usual scenarios with a bit of wind are totally insufficient and I wonder why so many people who seem to be concerned about climate change appear so happy with such tinkering. I am tempted to say (adapting the well known quote from Richard Feynman) such schemes relate to climate change mitigation in the same way as masturbation relates to sex. You are free to demonstrate my estimates wrong. You have access to the same data I used. If the benchmark is set to studies concerned only with small amounts of wind set in the huge background of fossil fuels, I consider you remark about my approach being “unconventional” as a compliment. (I kind of feel that way in any case…)
I don’t really understand this either? Why would you want to assess the adequacy of storage (it’s contribution to replacing thermal sources of reserve capacity, or effective load carrying capacity) in terms of a percentage of yearly production? If a 1000 MWe nuclear plant operating at 90% capacity produces 7.9 TWh of energy in a year, do we need a battery 876 GWe in size (the remaining 10% of yearly production) to cover the paltry 1.4 GW of peak demand we are likely to encounter on any particular day?
You might want to have a look at this rather interesting study. Your model is good enough for very low penetrations of wind, but starts to fall apart at high penetrations of wind (with energy storage entered into the mix). Round trip efficiency is not the only issue to look at. Energy storage dramatically changes the calculation quite a bit with respect to costs, particularly at very high levels of wind penetration, because excess wind that is not needed off the peak can be stored rather than curtailed (and costs associated with fuel, start-up of thermal generators, O&M, and any carbon costs are avoided). Storage also has a capacity credit, and when combined with wind contributes to reducing the planning requirement for additional thermal capacity to achieve full system reliability at peak load intervals. You don’t seem to acknowledge this. There are definite costs associated with conventional generation in a portfolio mix including wind (reserves operating at low efficiency or capacity, fuel, O&M, start-up, etc.), and these costs are offset at a particular inflection point with storage added into the mix. Which is to say they do not rise indefinitely over the entire resource mix to 100% wind (when more cost effective reserve capacity alternatives start to kick in). According to the above study, this price inflection point is reached at 48 – 51% variable generation, at which point a break even point is reached between pumped hydro (utilizing current costs) and CCGT thermal generation. You need to do a LOLE analysis on how much storage will be needed to achieve full system adequacy. In the study referenced above, it was found a 500MW pumped hydro reservoir with 5 GWh (10 h) storage was sufficient to replace a 500 MW conventional plant (providing for a 34-68% resource mix from wind). The test case is for Ireland with a 53.9 TWh net load, 9.5 GW peak demand, 3.5 GW minimum demand, €30/tonne carbon cost, 78% roundtrip efficiency on pumped hydro, €1.5 million/MW capital cost, 20 year operating life, 8% discount rate, 8h LOLE, 10-20% capacity credit for wind, and more (specified in study).
A few conclusions from study:
– “it can be seen that storage increases its value to systems when curtailment becomes significant. The level of curtailment will depend on the wind variability and the operation of baseload plant on the system; if there is a large portion of baseloaded plant on the system which cannot be turned off easily, curtailment may be higher than that shown here and, therefore, storage may become valuable at a lower level” (p. 1973).
– “The market design may also influence the value of storage … certain market features such as long term bilateral contracts on interconnection may limit the flexibility available and, therefore, storage may be undervalued in this work” (p. 1973).
– 5GW/h (10h) storage is adequate to replace conventional reserve capacity in test model. “This leads to the idea that storage has a capacity value (Garver, 1966) which is dependent, not only on forced outages as other plant, but also on the size of its store and the amount of wind. Therefore, at high wind penetrations, storage would need to be large enough if it is to adequately replace conventional plant” (p. 1973).
– “It is seen that the major advantage offered by storage is a reduction in wind curtailment at times of high wind. However, due to the high capital costs and inefficiencies of pumped storage, storage does not justify itself from a systems economics basis until greater than approximately 48%–51% of energy is obtained from wind on the test system, which is a possible plant mix for the Irish system in 2020″ (p. 1974).
@EL: Thanks for the link. Few comments.
1)”Why would you want to assess the adequacy of storage (it’s contribution to replacing thermal sources of reserve capacity, or effective load carrying capacity) in terms of a percentage of yearly production? If a 1000 MWe nuclear plant operating at 90% capacity produces 7.9 TWh of energy in a year, do we need a battery 876 GWe in size (the remaining 10% of yearly production) to cover the paltry 1.4 GW of peak demand we are likely to encounter on any particular day? ”
If your demand is about 9GW (ignore demand fluctuations for now) and you have 10×1 GWe installed nuclear, one NPP can be offline and demand is still met. For NPP:s those periods when they are down are typically scheduled well inadvance. Normal powerplants (gas,coal, nuclear, hydro, biomass…) ARE in a sense batteries. A refueled NPP has enough energy stored in it to produce power for about 18-24 months typically. There is no need, in principle, for additional solutions other than to have sufficient power plant capacity available.
For wind the required storage is set by the looking into how the level of the storage varies over the year. I showed this and encourage you to check the result for yourself. In order for the system to work without fossil fuels, the battery must never be empty.
In the link you provided they assume about 10h storage, but do not demonstrate that their wind+storage is then sufficient to cover demand. Common sense tells that it is not (and the production data I showed). There are much longer than 10h periods of low wind production.(Where I live, wind speed has been low for days now.) Furthermore, if Irish peak demand is 9.6 GW, then the output from the storage must be this high to cover the possibility of no wind during peak demand. Also, it is quite clear that postulating storage in say Ireland will not make it appear, since required amounts of storage hit the boundaries set by the topography. Where I live the kind of hydro storage I mentioned in the text is TOTALLY unrealistic and will NEVER occur because of the topographical constraints. Same is true in most other places.
You do save fuel with storage schemes and they can lower the required spinning reserves and such, but this must always be set against the costs of storage and the fact that insufficient storage still necessitates the maintenance off a large fleet of normal power plants and somebody has to pay for those.
And how often, and for how long, does this low wind period coincide with peak demand? Your model presumes that over production of wind is either curtailed or sold for export (rather than reinvested in a storage device for later use and to offset reserve capacity requirements). I find this an entirely faulty approach, and especially for very high penetrations of wind or variable generation. Since you appear to have your data (which is very extensive) in a database for your own analysis, care to tell us how much “over production” is going on, and what the picture looks like if we were to store this energy (rather than curtail it for a very low capacity factor), and utilize it for load leveling, peak shaving, and other power quality or grid re-enforcement applications. Telling me to do the work (when the database is some 1912 pages long) is not selling me on your result!
With storage in the mix, why would we be content to waste this energy, amounting to some 6% of the actual output from wind plants (in your example, amounting to some 5.3 TWh/year … or enough energy to light up Kosovo, Panama, or El Salvador with it’s 6.8 million people).
CANES recently had a paper which touched on storage needs for a couple of technologies: http://canes.mit.edu/content/nuclear-energy-variable-electricity-and-liquid-fuels-production
The CANES study is for California data. In my province of Canada, demand tends to be lowest in the spring, when hydro is strongest (due to the spring melt), and wind is strong, and demand is highest in the summer, as hydro has dwindled and wind is week. 8 hours of storage isn’t relevant in that scenario.
The CANES paper discusses seasonal storage options too.
@EL: You must be joking. The data is data and there are tools to analyze it. Do you actually think that anyone handles such datasets by hand? Like I said, if you are not happy with what I said you are free to start working and demonstrate how you get different results. Just spreading smoke around is of no interest to me. (Also, who is paying for the electricity not needed? You seem to think that such production is of great value…We seem to have a bit different perspective to economics.) Ps. you are free to have the last word, since you probably want to have it. I have other things to do…
If you store it, ratepayers are paying for it, but at a 22% efficiency loss if we are using pumped hydro, the value of which can probably be recouped through energy arbitrage. Storing surplus energy when the demand period is low also improves the performance of your baseload generators, raises the capacity factor of your wind plants, reduces your operating reserve requirements, and minimizes costs associated with supplemental or standby generation and ancillary services. It is entirely unclear to me how you will be charging your pumped hydro storage reservoirs … since you appear to be unwilling to utilize wind energy except when it meets your schedule. This seems to be a rather major oversight of your article, and it is unfortunate to me that you no longer wish to defend it (especially when you appear to have such confidence in your final result)?
EL — “No arithmetic, no argument.”
First do a convincing simulation complete with a comparison to a 100% NPP powered grid.
[…] variability of wind power was put to a stern test by Finnish physicist Jani-Petri Martikainen in this recent post. Martikainen’s analysis obliterates the assertion that distance between wind […]
Jani-Petri Martikainen,
This analysis of yours is excellent. Very well done.
You may be interested in a recent experience of mine. I have been trying to get peer-reviewed and published an analysis that I completed some months ago of AEMO wind farm operational data. In it I considered the total output of wind farms spread across the south-eastern Australian grid for the 12 months of the year 2010.
As Peter Lang has indicated above, the already built wind farms on the eastern Australian grid, of some 2000 MW installed capacity in total, are spread across the larger east-west extent of this relatively large region, geographically the largest interconnected grid in the world, so their combined performance ought to provide useful information to planners both in Australia and worldwide.
On over 30 occasions during that period, windfarm output collapsed to less than two percent of total installed capacity. An examination of the synoptic conditions prevailing during each such event showed a very strong correlation between the periods of very low or zero output with the occurrence of very large high pressure systems “camped” across eastern Australia. As “Cyril R” has already asserted, it is not a matter of wind turbine reliability – it is simply the fact that these times of little output are due to there being no wind anywhere across the region to power the windmills.
This meteorological source of the common-mode failure indicates that it does not matter whether the wind farms are clustered in any part of the region or spread out across it. Indeed, the analysis makes clear: whether there were 10 or 100,000 wind farms within and across this region during 2010, the same minimum number of lulls in output would have occurred.
To an engineer, this is an example of a common-mode failure: it is another way of saying that the entire wind generation fleet has failed at those times. Such a fault condition would never be tolerated in conventional, “reliables”, plant: it would result in an immediate, national, full-scale Inquiry. Given this outcome, I see little need to conduct any probabalistic assessments: at a level of over 30 common-mode failures per annum, assessing the probability of such an event happening seems largely irrelevant. Furthermore, my analysis shows that for each increment of additional new wind generation plant, additional conventional, but fast-acting, backup plant, of the same installed capacity, must be installed to counteract these failure events. This is in general agreement with Jani-Petri’s findings.
What is serious about this complete failure of wind generation is that policymakers seem to be totally unaware of it. At present, in Australia, we have the situation that government planners subscribe to the view – seemingly as holy writ – that the total wind output varies smoothly about some mean figure and that, as a result, wind farms require just a little bit of backup generation, that this requirement can be met by existing backup plant already provided to deal with failures of conventional plant. Given that total wind plant fails so often, I would have thought it prudent that, as the scenario that such a synoptic no-wind event as described above will happen at the same time that a large conventional generator fails is indeed very likely, then this critical incident scenario ought to be considered in detail by those authorities as a matter of urgency.
The real-world data that I used for my analysis supports Peter Lang’s comment above: the suggestion that wind farms can ever supply the base load is mere mythology.
Reviewers’ comments on my journal submission have been interesting. As with some of the comments here directed towards Jani-Petri, it seemed that, in taking an approach that, according to one reviewer, is radically different to that of others, I stood somehow accused. It seems that, in her/his view, it was some sort of “crime” that I have confined my analysis to the consideration of real wind farm operational data! My analysis has also been found inadequate by one reviewer in that it does not give due deference to some highly-publicised, but non-peer reviewed in advance, computer model studies. I am at a loss to understand this criticism: as a young engineer, it was impressed on me that any system model that I might devise must always faithfully simulate real-world data, otherwise it would forever remain a mere figment of my imagination.
My analysis shows that the output of wind farms spread east-west across what is geographically the largest interconnected grid in the world is highly intermittent, is totally inadequate to address real power requirements, and is highly destabilising. Even with fast-acting backup plant of sufficient capacity, in the situation that wind plant is a portion larger than a small percentage of total installed generation capacity, it poses a very real threat to grid security. As a result, the scenario, as also suggested by Jani-Petri, that widespread, frequent, and unscheduled backouts becomes the norm, is indeed quite credible.
Paul Miskelly
Paul Miskelly — Thank you. I hope you will be able to counter the referees’ positions in your reply to the editor.
I’m not exactly sure what you are trying to show in your study? It seems to me you are focused on demonstrating that the geographic dispersion of wind plants contributes very little to their upgrade as “firm” capacity, or as “baseload” generators. I’m pretty sure this is well known (except when looking at proposed models for grids dispersed over a very large area, such as the Western United States, or when there are significant amounts of energy storage or other energy conservation methodologies thrown into the mix). This is very different from showing that geographic dispersion of wind farms contributes to “smoothing,” and thus minimizing frequency instability and expensive back up or infrastructure requirements for dealing with very steep ramps. If the purpose of your study is to show that wind displaces fossil fuel generation (up to a certain percentage of capacity), and to quantify what role geographic dispersion might have on this (when measured against a single farm), I think you might have a very different result. And you could probably quantify your findings with respect to several measures: carbon mitigation potential, cost of energy (and the impact of ancillary services), operational standards (and reliability), and cost of carbon mitigation.
Did you have a chance to look at “The Variability of Interconnected Wind Plants” (Katzenstein et. al., 2010) with respect to your study? It provides a pretty good review of the literature on wind smoothing and geographic dispersion to date. And it is also a study, like your own, that looks at actual wind data (in this instance, power output from 20 wind plants within ERCOT region). By and large, they seek to recommend a new methodology (frequency domain analysis) to other techniques for assessing wind “smoothing” and geographic dispersion (such as “10-min step change histograms, correlation coefficients, and LOLP assessments). So if reliability and systems disturbances from wind integration are one of your concerns, I would have a look at this study (and try and see what impact your data on geographic dispersion and weather related interruptions in AEMO region have on any of these frameworks and concerns). With respect to high-frequency regulation, they conclude that interconnected wind plants “significantly” reduces their variability: “The amount of smoothing is a predictable function of frequency, correlation coefficient, nameplate capacity ratio, and the number of interconnected wind plants” (p. 4409). They also look at year to year power production scenarios. In fact, they project their analysis out to 36 years and try to capture impacts from “wind drought periods” (on an annual basis), and compare this to hydroelectric plants (and impacts from rainfall droughts). They conclude: “yearly wind power production is likely to vary, and have year-to-year variations about half that observed nationally for hydropower” (p. 4409).
It’s probably worth having a look, I’d be interested in your assessment of other research in this area (and what contribution your own study is likely make to this research, or any other articles in this rapidly developing and important field of study).
@Paul Miskelly: Thanks. Your comments and experiences are very interesting. (While I am a pro-nuclear, I note that Fukushima also had “common mode” failure in that all the backup generators were located so that all failed at the same time. Of course, in that case the design error can be corrected with proper engineering, but for wind it cannot.)
Sad to say I am not entirely surprised by the referee comments. To me it seems that quite a few really bad papers on renewables get published anyway, probably because the message is desired. Even those who do have intellectual integrity seem to feel the pressure to change their wordings so that the message sounds good. I suspect there is also a sociological reason for this bias. 1st, renewable energy attracts mostly those who already think it is a good idea. The rest find other topics more worthwhile. 2nd. In many places you get funding for studying renewable energy and getting funding is easier if you aim for and report success. (Try getting a grant, by declaring that you intend to show why others are doing bad job.) If you end your project concluding, this was a really bad idea you kind of suggest that your group should not be given money to study this ever again. But the PhD students and others will still need their funding. 3rd, Your referees are most likely people whose own publications are undermined by your study…so intellectual clarity has its risks.
I hope your results get published and please send a citation when it does. Good luck!
AEMO has recently lowered the usual 95% availability for conventional generators to 85% for wind in South Australia, with the resulting firm capacity “lifting” to 5% in summer and 3.5% in winter.
http://www.aemo.com.au/planning/SASDO2011/documents/CHAPTER5.pdf
[…] previous post, Geographical wind smoothing, supergrids and energy storage, focused on distributed wind alone. In this follow-up, he turns his attention to solar combined […]
Perhaps something said by Lord Kelvin would be appropriate here. He asserted that knowledge that cannot be expressed in numbers is not knowledge; it may be the beginning of knowledge, but it is of a meager and unsatisfactory sort.
I wish that people pushing renewables would carefully consider what Lord Kelvin said. Instead, they seem to ignore it. They simply assume that renewables would work, thereby also ignoring one of the definitions of “assume.”