


.png)
 To round out the controversial critique of solar power started here, I reproduce below the most detailed critical analysis I’ve read on solar thermal electricity. It’s written by a University of NSW academic, Ted Trainer. I’d strongly encourage you to read his full 44-page set of arguments on the inability of renewable energy to sustain an energy intensive society (an earlier version of which was reviewed last year on BNC — this provides an updated summary of his 2007 peer-reviewed book on this topic, published by Springer).
For context Ted and I agree on many things, but not all. We both acknowledge the seriousness of the climate crisis and the magnitude of the sustainability problems caused by humanity’s overexploitation of natural environments. We differ in that Trainer sees only one viable solution — a rapid, planet-wide ‘power down’ of civilisation to some ‘simpler way’ (read here for his well-mapped-out thesis).
In the past year Tom Blees and I have exchanged a number of emails with Ted, in which we’ve talked about Generation IV nuclear power (IFR in particular), proposing it as a potential ‘uranium-thorium bullet’ to solve the energy crisis — and, as a result, providing the clean energy to solve a whole host of global problems such as climate change, water supply, agricultural sustainability and repairing the damage we’ve inflicted on natural systems. To his credit, Ted has looked at my arguments seriously, and has come up with a range of questions on Gen IV nuclear on which he requires ‘clear and convincing information’. As such, in a future post on BNC, I intend to address his nuclear critiques. But that’ s for another day.
The examination of solar thermal electricity given below is quite detailed, yet necessarily incomplete. Reliable data are simply lacking on many critical points. At the foot of this post, I list some key knowledge gaps on which Ted seeks further data. Perhaps you can help. For now, read on!
———————————————-
SOLAR THERMAL ELECTRICITY (for the reference list, see here)
The major drawback for renewable energy is the inability to store electricity from intermittent sources. Solar thermal technologies are especially valuable because they can store heat and use it to generate electricity when it is needed. Some believe this capacity will be the key to enable renewable energy sources to meet all electricity needs (e.g., Trieb, undated, Czisch, 2004), for example plugging gaps left by PV and wind.
Solar thermal systems are best suited to the hottest regions and it is not clear how far into the mid latitudes they can be effective, apart from via very long transmission lines. They seem to be especially doubtful in winter, even in the best locations. (For a more detailed discussion of solar thermal’s limits and potential see Trainer, 2008.). Trough systems will be considered first, then dishes.
Troughs
The winter electrical output for the US SEGS VI trough system is reported at about 20% of summer output. (NREL, personal communication.) Modelling for Central Australia, possibly the best solar thermal location in the world, by Odeh, Behnia and Morrison (2003) produces a figure closer to 12%.
The SEGS VI plant with its north-south troughs was not designed to maximise winter performance. Arranging the troughs on an east-west axis, as distinct from the usual north-south axis, would raise the winter/summer ratio for energy entering a trough. (“Polar axis” alignment of troughs enables maximum energy yield, but is not feasible for large scale power generation.) However even in good solar thermal regions the performance of east-west troughs in winter (and summer) is relatively low, compared with the summer and annual average performance of north-south troughs. This is evident in Figure 1 from Odeh, Behmia and Morrison. Summer thermal energy (not electrical output) entering a NS trough at Alice Springs would be 780 MJ/m/month, (in this document “m” represents square metre) whereas in winter from and EW trough it would be 430 MJ/m/month, or 4 kWh/m/day.
The radiation data given by RREDC (undated), Meteonorm and ASRDHB, 2005, point to the same general conclusion. These sources indicate that Alice Springs is a better location than Egypt, receiving possibly 50% more solar energy per metre in winter. It also seems to be a little better than the SW US. Thus if solar thermal technologies are problematic in winter at Alice Springs they are not likely to be viable in the US or for Europe.
A critical problem for solar thermal systems is what proportion of collected heat is above the threshold level required for generation of sufficient steam pressure. In regions where radiation is low to moderate, considerable heat energy could be collected without enabling generation of a significant amount of electricity. For SEGS VI radiation appears to have to reach 700 W/m (DNI or direct normal irradiation, not global radiation) before generation becomes moderate, and at 500 W/m it is only about 33% of maximum. (NREL, undated, Jones, et al., 2003, Figs. 5 and 14.) Thus if east-west trough collects 4 kWh/m/d, as Fig. 1 from Odeh, Behnia and Morrison indicates, not all of it will be at a sufficient intensity to generate electricity.
ASRDHB data show that for Alice Springs in winter the intensity of DNI per square metre entering an east-west trough averages only 408 W/m, over a 12 hour period. It is over 700 W/m for about 7 hours. Fig 3 from Odeh, Behnia and Morrison shows that at Alice Springs 26% of DNI received over a year is under 500 W/m and 18% under 350 W/m. These figures suggest that the 4 kWh/m/d entering the trough is a misleading indication of electricity likely to be generated and that the actual output could be less than half this amount.
More direct evidence comes from the SEGS VI record. Hayden (2004, p. 190 .) reports that the 2.3 million square metres of collectors average 77 MW over a year, which corresponds to a continuous flow of 33 W/m. The above evidence is that winter performance is about 30% of the average performance, which is a solar to electricity efficiency of 10.7%. This suggests that the winter figure would be a 24 hour average c.13 W/m.
From this very low gross output a number of factors must be deducted, the main two being the energy required to build and run the plant. The latter energy losses, mostly for pumping fluid through the absorber, are given by Sargent and Lundy (2003, Section 4 – 3) at 17% p.a., although they estimate that in future the figure will be under 10%.
The embodied energy cost, i.e., the amount of energy needed to build the power plant, is reported by Dey and Lenzen at c. 4% of gross output for a plant of normal size in normal conditions. However a plant capable of delivering 1000 MW in winter would have to be 2.5 times as large as one capable of this output as an annual average, so its embodied energy cost would be that much higher.
(It would then generate much more than 1000 MW in summer and the ratio of embodied cost to total output would remain c. 4%, but a problem would then be that summer output would be far in excess of demand. On problems in storing such a surplus as hydrogen see below.)
The embodied energy cost analysis of solar thermal systems must also take into account the energy cost of building and maintaining the long distance transmission lines, e.g., from North Africa to North West Europe and of transforming from DC to AC power. The lines might add one-third to power plant dollar cost. (Czisch, 2004.)
The loss of energy from solar thermal storage is low but has been estimated by Sargent and Lundy as .9%.
Finally, the loss of energy in the very long distance transmission has to be taken into account, e.g., from Egypt to NW Europe. This could be 15% of gross output.
Some of these numbers are uncertain but when combined they indicate that the total energy loss might be 35% of the meagre gross output, meaning that a net delivered amount well under 10 W/m might reach users in winter. If so plant capable of delivering 1000 MW in winter would need 100+ million square metres of collection area. At the estimated SEGS cost of $800/m (i.e., per square metre, not per kW)) the plant would cost $80 billion. (Trainer 2008
More confident data on trough performance in winter would be desirable here, but troughs would not seem to be viable. (Heydon’s account comes to a similar conclusion.) Note that the vision of abundant winter supply to Europe via troughs would involve harvesting radiation at about 55 degrees from the vertical.
Dollar costs.
Sargent and Lundy (2003) put the capital cost of solar thermal plant at $(US)4,589/kW ($(A6,556) for the “near term future” (including heat storage, which reduces required generator capacity and cost, by enabling the generation rate to be levelled out.) NREL say the 2003 equivalent price of the SEGS plant is $(US)7,700. These figures are to be compared with $(A)3,700 million for coal plant plus fuel (early 2000s price) over plant lifetime. These figures are for peak outputs and the average output from a coal plant is c. .8 of peak whereas for a solar thermal plant it is around .25 of peak capacity (in the best locations). Thus capital cost per gross kW delivered on average (as distinct from peak) from solar thermal plant would be over 7.5 times as great as for coal including fuel. (See Trainer, 2007, Chapter 3.) Transmission lines from the Sahara to Europe under the Mediterranean Sea would probably add more than 33% of generating plant capital costs. (Czisch, 2001, 2004) indicating a multiple of 10. Note that these figures are not for plant large enough to deliver well in winter and for SEGS VI this factor might multiply by a further 2.5. Note also that dish costs are at presently much higher than trough costs.
Again future materials, energy and construction costs are likely to be far higher than at present so these figures are not very meaningful guides to future viability.
Water pre-heating.
A solar thermal plant near Sydney, NSW, some 34 degrees south, has been constructed to pre-heat water for a coal-fired power station. ( Mills, Le Lievre and Morrison, 2000.) This is sometimes taken to show that solar thermal systems are viable in the mid latitudes. However this system delivers heat at about half the temperature required in coal-fired power stations, and therefore does not have to concentrate solar radiation intensely. The absorber is about 1 metre wide and therefore reflectors can be wide with little curvature. Thus the capital cost is quite low. These features indicate that this plant is not a good guide to the effectiveness or cost of solar thermal plant at this latitude that would generate electricity without augmenting fossil fuel power generation. In a world that did not exceed safe greenhouse limits there could be few if any fossil fuel plants. Also the performance of the system falls markedly in winter as the above discussion would lead one to expect.
Dishes.
Dishes collect more energy in winter because they can be pointed directly at the sun, but there are two significant drawbacks. Their dollar costs are reported as being 2 – 4.5 times those of troughs (Sandia, undated), although costs will surely fall considerably with further development and mass production.
The data I have been able to access indicates somewhat surprisingly low but useful winter output from dish–Stirling devices. Some US dishes seem to have an average 24 hour flow equivalent of around 20 – 30 W/m (Davenport, 2008.) An output plot for the Mod dish-Stirling device shows that the January average flow (averaged over 24 hours) was c. 18 W/m, and for December, 22 W/m. Commonly published power curves show that at 700W/m output falls to around half peak output.
However this is not very relevant to our problem. If solar thermal systems are to provide electricity 24 hours a day, and also to solve the general intermittency problem set by other renewables, then heat must be stored. This means that the efficiencies will be much lower than those represented in the literature on dishes, which almost entirely deals with the direct generation of electricity via dish-Stirling systems. Dishes are not well suited to large scale heat collection.
Trough systems transfer heat long distances to the power block mostly through the absorber pipes, which are heated as they collect radiation (nevertheless 4% is lost, according to Sargent and Lundy, 2003). With a dish system this would not be so and either very long pipe distances would have to be insulated and would still lose much heat energy or many small generators would have to be located close to groups of dishes. (The equivalent of a 1000 MW plant in winter would involve tens of thousands of big dishes; below.) For these reasons the European and US dish developers I have contacted regard the use of dishes to collect heat as not being viable. (Personal communications.)
Kenaff’s pioneering work at White Cliffs, Australia on dish-steam generation (without storage) achieved 9.1% annual solar to electricity efficiency. The ANU Big Dish has a 13.9% efficiency, which it is expected can rise to 19% in future. (Note that this is a measure at a point in time under ideal conditions, not a measure of recorded annual average performance; which would be considerably lower, e.g., because of dust build up, warm up delay after cloud, etc. and winter performance.) I do not have figures on the winter performance of either system. If we assume 5 kWh/m/d radiation, the White Cliffs 15% loss of heat between collector and engine room, the 19% heat to electricity generation efficiency Lovegrove expects, and an 8% energy cost for pumping (the trough figure), then output might correspond to a gross 31 W/m 24 hour average flow. However this assumes 1000/m radiation and in winter radiation barely rises above 700 W/m, which for dish-Stirling generators cuts output in half. Again Kenaff’s evidence is that steam generation is significantly affected by lower DNI. (See Trainer 2008 for more detail.) Very important is the fact that the White Cliffs system involved only 14 rather small dishes and thus a very short distance for heat to be moved to the engine room, and the Big Dish is a single unit close to its steam generator. For the equivalent of a 1000 MW plant very long distances would be involved (or many small power blocks.). Thus it is not possible with this information to estimate a winter average net output after heat storage, but it would seem likely to be well below 30 W/m.
The heat storage strategy using dishes which looks most viable is that being developed by the ANU group, involving the use of ammonia dissociation as a means of heat storage (Lovegrove et al, 2004). Perhaps its main advantage is that no insulation is required, so heat would not be lost from the storage pipes or tanks. (The energy is stored chemically, in the splitting of ammonia into hydrogen and nitrogen.) This system is being built into a commercial plant at Wyhalla, South Australia. It is estimated that half the energy entering the dish might be available for generating after storage by this means. (Wizard Power personal communications.)
The designers cannot predict performance confidently at this stage (personal communications), and understandably will not make the technical information they do have available. It would seem from above that if Big Dish efficiency can be raised to 19% then after storage at 70% efficiency, then can overall efficiency of 1.3.% could be achieved. Gross winter output in Central Australia then might correspond to the region of 28 W/m continuous 24 hour flow. (At present Big Dish efficiency the figure would be 19.8 W/m/.)
Several factors would reduce this gross figure, including the effect of warm up delays after the passage of cloud, operating energy costs, energy embodied in the construction of the dish and the long trans mission lines (“emergy”), energy losses in those lines, and especially the embodied energy cost of the ammonia processing plant (including the reactors in the dishes which dissociate the ammonia, and the one in the power block that recombines it.). The emergy implications of the ammonia processing plant are difficult to assess, and could be problematic. The attempt sketched in Trainer 2008 suggests supply from a 1000 MW plant, taking the most favourable of the estimates for storage volume received (17 litres per kg of ammonia, and 4 MJ/kg), might require some 2,800 km of one metre diameter gas pipe, the intended containment vessel.
Also a concern is the fact that big dishes (Whyalla will use 500 square metre dishes) involve disproportionately higher materials and energy costs for structures, foundations and drive equipment, in view of the higher wind stresses they will have to cope with. An uncertain estimate based on the materials in the ANU Big Dish indicates an embodied energy cost three times that of troughs, i.e., in the region of 13% of plant lifetime output. (Trainer 2008.) However the developers believe other advantages of big dishes outweigh these factors, although I do not know whether this is only a dollar cost calculation or one focused on embodied energy costs. There is a high probability that in future the cost of materials and construction will be far higher than they are now.
These figures suggest that a solar thermal ammonia storage system will be capable of low but significant/useful net output in winter. From above, net energy delivered to distant users would seem likely to correspond to around 20+ W/m of collection area (not plant area including space between dishes). However it is not clear that the very large numbers that would be required could be afforded. On the above estimates a plant capable of delivering 1000 MW in winter might have to include up to 50,000 big dishes each of 400 square metres. These would probably have to be spread over an 11+km x 11+ km area. Just to connect the dishes to the power block would probably require some 2,800 km of pipe, although it would not have to be insulated. This seems to be about the length needed for storage above, but easily overlooked is the need for the same length of pipe to carry the recombined ammonia back to the dishes from the power block. Having many small plants rather than one big 1000 MW plant would not alter the overall ratio of pipe length per kW output. The total 5,600 km of steel pipe capable of taking 15mPa pressure might weigh 280,000 tonnes and have an embodied energy cost of 11.2 PJ. This is around 45% of the annual output of a 1000 MW power station (assuming .8 capacity), so the embodied energy cost of the pipe alone might add 2.2% of lifetime output to the total embodied energy cost figure.
Also of concern is the fact that if net delivered output corresponded to a say 25 W/m flow in winter, then it would take 46 metres of dish collection area to sustain one person at the Australian average electricity consumption rate, meaning that the ANU Big Dish would provide for only 8+ people.
Direct hydrogen production.
It is possible to produce hydrogen by splitting water at high temperature, around 800 degrees, and a practical application of solar thermal to this strategy is being discussed. (Taylor, Davenport and T-Raissi, 2008 ) A theoretical 40% solar to hydrogen efficiency is thought to be achievable. If this becomes viable it would probably be the best option, although it would involve the usual problems in large scale handling of hydrogen. These include pipe embrittlement, leaks, and the very low energy density meaning either very large storage volumes and/or high compression. Especially problematic are the energy losses in long distance transport. Bossell estimates that to pipe hydrogen from North Africa to Western Europe could require more than half the energy despatched from Africa. Ideal solar thermal sites are a long way from demand.
A system designed to deliver 1000 MW after storage would need a 1000 MW hydrogen-fuelled power station in addition to the dish system which generated the 1000 MW supply of hydrogen to run it, indicating high capital and embodied costs. The efficiencies of the various steps (e.g., .4 for hydrogen production, .8 for handling/transport, .4 for fuel cell generation) suggest an overall gross solar to wheels/use efficiency of 13%, from which the embodied and operating costs of materials-expensive hydrogen handling plant would have to be deducted. It is therefore not clear that this path would be more viable than the others considered above.
The intermittency problem.
The heat storage capacity of solar thermal systems overcomes some of the intermittency problems that trouble wind and PV systems, such as the occurrence of night time. The standard provision will be 12 hour storage enabling continuous 24 hour electricity delivery. However examination of climate data reveals that even at the best sites sequences of 4 or more days without sunshine are not unusual. The best US sites often have 2 runs of 4 consecutive days of cloud in a winter month. (Davenport, 2008)
If 1000 MW(e) output was to be provided for four cloudy day from stored heat, some 290,000MWh of heat would have to be stored. Storage cost has been estimated at $(A)10/kWh(th) meaning that the required storage plant would cost more than $8 billion, or around twice the cost of a coal-fired plant plus fuel. However this refers to trough technology and it is likely that for the ammonia process costs would be higher.
Again we would be faced with the prospect of very high capital costs for a large amount of plant that would not be used most of the time, and would still be insufficient occasionally. There would also be the question of whether there would be enough solar radiation in winter to meet daily demand and also recharge a large storage sufficiently to cope with the next run off 4 cloudy days.
The climate evidence given in Trainer 2008 seems to show that solar thermal systems even at the best locations would suffer a significant intermittency problem, despite their capacity to store energy.
Another problem is that if solar thermal plants are to help buffer the intermittency of inputs from other renewable sources then a major cost saving often claimed for solar thermal systems would not be available. The ability to store heat from peak mid day collection and generate with it at a much lower constant rate, perhaps .2 of peak capacity, means that much smaller and cheaper generators can be used, perhaps one fifth of the capacity that would be needed to use heat energy at the mid day rate of collection. The power block can make up around half of a solar thermal system’s cost so the saving in capital costs, energy costs and operations and management is considerable. However if the solar thermal component of a renewable supply system must at times plug gaps left by variable wind and sun, then there will be times when it must meet almost all demand and so its individual stations must often be cable of generating at much greater than average rate.
There would also be a problem regarding the need for solar thermal plant to rapidly ramp up to high levels of output, in order to meet most of the demand when sun and wind energies fall suddenly. Thermal generators can’t be brought up to full output quickly.
It is sometimes assumed that solar thermal systems will enable the gaps left b y other renewable sources to be smoothed out, by use of solar thermal heat storage capacity. For this to be plausible storage capacity would have to be extremely large. The following figures seem to show that this proposal is not viable.
If the solar thermal system was to average .3 of total electricity supply yet had the storage capacity to meet total electricity demand through 4 calm and cloudy days, then its storage capacity would have to be 24 times as great as for 12 hour storage. In addition its collecting capacity would have to be considerably greater then that required for average output, in order to accumulate such a reserve.
This evidence seems to mean that there is no chance that the capacity of solar thermal systems to store energy could overcome the problem of gaps left by combining the output from the other renewable energy sources, as some have hoped.
Solar thermal conclusions?
The climate data seems to show that despite their storage capacity solar thermal systems would suffer a significant intermittency problem and in winter would either need storage capacity for four or more cloudy day sequences once or twice each winter month, or would need back up from some other sources. This means they could not be expected to buffer the intermittency of other components in a fully renewable system.
It seems that troughs suffer a big drop in output in winter, that dish-steam systems cannot operate well enough on stored heat and that hydrogen generating systems are too handicapped by the usual difficulties associated with hydrogen. The prospects for satisfactory winter supply of electricity from solar thermal systems therefore seem to depend on whether or not the dish-ammonia system will be viable on a large scale, and capable of overcoming intermittency problems. The unsatisfactory information available suggests that they will be significant contributors but are not likely to make possible reliable winter electricty supply at a tolerable cost, that they will suffer a significant intermittency problem, and that they cannot be a solution to the integration problems left by other renewables.
The dumping and additivity problems (for technosolar in general)
Discussions of renewable energy contributions to total demand also typically give little or no attention to the problem of energy dumping set by the variability of renewables. This increases the need for energy conversion and lowers average capacity factors. Consider a system in which over time wind and PV each supply one-third of demand (i.e., .33 x total demand). The world average wind farm capacity is .23, which means that at times output from a farm will approach 4.3 times average output. For PV systems in good locations annual average capacity is probably about .18, meaning that on a sunny day a system will be producing about 5.6 times average output. Now consider a system in which wind and PV components each contribute on average .33 of total demand. On a sunny day which is also quite windy these two components might be producing about 3.3 x (total demand). So even if the non-renewable components in the system can be shut down, 2.3 times as much energy as is needed would have to be dumped, or stored inefficiently as hydrogen. This would have a dramatic effect on the system’s average capacity measured in terms of energy actually used. (Storing as hydrogen and regenerating via fuel cells might yield no net electrical energy when system operating and embodied energy costs are deducted from the perhaps 25% of energy available after conversion, storage and retrieval.)
Stern’s Fig. 9.4 shows that this dumping problem has not been taken into account. Total demand is divided into components reflecting averaged or annual contributions with no consideration of what would happen when some or all are performing at their peak capacity rather than at average capacity.
The variability between summer and winter would more or less double the magnitude of this problem for solar sources, given that in good solar regions winter insolation is about half the summer value. (The multiple is greater in the lower latitudes.) Thus a PV system designed to meet 30% of demand in winter might meet 60% of it in summer. The effect would be offset to some extent by the fact that winds tend to be higher in winter. However with daily variability the effects compound rather than compensate; i.e., at night when there is no solar input winds tend to be lower.
Renewables are not additive
Renewable energy sources are usually thought of as additive, that is, as if building X GW of wind capacity and X GW of PV capacity would give us 2X GW of generating capacity. However on calm nights these two sources would give us no generating capacity at all. Thus they are best thought of as sources which at times can be alternated with or substituted for coal fired power, but not as sources which can always be added to each other. (Stern’s Fig. 9.4 reveals that the various components are being thought of as additive.) This means that we might have three or more very expensive systems each capable of more or less meeting demand while the others sit idle, and in addition we must retain a coal or nuclear system capable of meeting most or all demand when most or all the renewables are down.
——————————————————-
Questions that arise: (from a recent email to me by Ted)
1. How viable is storing heat from dishes? My European contact says not worth it. There would be long distance piping from tens of thousands of big dishes for a 1000MW power station, and thus large heat loss. With troughs heat moves through heated absorbers most of the way.
2. Where can we get performance data, for the different ST types, for every day of the year, along with solar radiation data for the sites in question?
3. What is the embodied energy cost of the ST types; Lenzen and Dey say 4% for troughs, but my attempts to check this are unsatisfactory, and it seems that for dishes the cost would be much higher (Derived from big dish materials inventory.)
4. Analysis is required of climate data for Eastern Sahara, SW US, and Central Australia, especially actual daily pattern of radiation (ideally pattern of hourly radiation every day.)
Another issue that require resolution concerns the angle between sun and reflector (the ‘cos‘ problem). With dishes this is no problem ever because you can point them at the sun anytime, so I have tried (in the above) to deal with dishes mainly, because if that’s problematic then towers and troughs are out…because they do have an intractable cos problem, especially severe in winter even in the best regions. Troughs it seems just can’t do it, as performance goes down to 20%- of summer output in winter in the US good sites. Towers (CR) are of course good for storage, but I’m assuming their cos problem is serious. It would be great to get some actual data on their year round performance. I have found it fiendishly difficult to get such data out of anyone; they seem not to want to make it public, and this makes evaluation of claims very difficult.
Another problem is that if heat loss is 1% over a 12 hr period, which is what Sargent and Lundy seem to say, then over a 4 day period this is 8%, so would have to be added to other factors detracting from overall ER and dollar cost situation. BOM is where to go for climate data (in Australia) and I have put some time into this. I could get more detailed information than I have but what I have indicates that there is a problem with sequences of cloudy days in winter, even in Central Australia. US seems much worse. Can’t get much confident data on North Africa, which is what ST electricity for Europe would depend on. Note a problem is time taken for systems to come back up to output after “transients”; i.e., passage of cloud. Can be significant I believe, and thus average radiation per day could be misleading; if this is made up of a lot of passing cloud and sun you might not total much time on full output.
——————————————————-
If anyone can help Ted source relevant information on the above (or if you have insider information, email him), I’m sure he’d greatly appreciate it.


Filed under: Renewables


Barry,
Thank you for that excellent article.
The comments I posted last night on the “Solar Power Realities” thread (Comments #304 to #308) are extracted from a paper I wrote over the weekend. The paper includes a rough cost analysis of solar thermal and a comparison with the cost figures for nuclear and solar PV from the “Solar Power Realities” paper. I need to check the cost figures for Solar Thermal before I post the paper.
I would be very interested in any comments and criticisms on my comments #304 to #308 (read #304 first).
With the Sahara-underwater HVDC-Europe idea remember that the Dakar car rally was moved to South America because of attacks by terrorists. The example of Basslink suggests that a lot of the time the Saharans will be re-importing lignite power, not exporting renewable power.
I think the cosine rule should be strengthened. For example cos (45 degrees) = .71 or 29% reduction but in practice insolation is even less.
I would argue that methane gas is a good form of energy storage since it can be made several ways and blended. It can run in both SOFC and ICE generators. High temperature hydrogen could be combined with modest amounts of carbon from biomass in the Sabatier reaction. The rate constrained CO2 from burning would be taken up by plants. This approach needs more practical work to set parameters.
Magnetite-to-wüstite conversion requires a dish concentrator
Fe3O4 -heating-> 3 FeO + ½ O2
but readily allows a solar power plant’s excess summer production to be stored for winter.
One could just reoxidize the FeO with air oxygen
to get on-demand heat, but it can also take oxygen
from other things. This is the oxygen-taking reaction that brought it to my attention:
B2O3 + 9 FeO + N2 → 2 BN + 3 Fe3O4
(How fire can be domesticated)
I wonder if Ted has considered
a) Solar + Stirlings and other renewables using pumped storage
b) producing syngas from waste (or other) biomass using concentrating solar
Ted Trainers conclusions:
“The unsatisfactory information available suggests that they will be significant contributors but are not likely to make possible reliable winter electricty supply at a tolerable cost, that they will suffer a significant intermittency problem,….”
I think most renewable energy advocates would agree with these conclusions. Solar energy can make a significant contribution to peak power in summer( when it is most needed).
However the other conclusion:
“… and that they cannot be a solution to the integration problems left by other renewables.”
is not justified for two reasons, Ted Trainer has ignored the important role that hydro electricity has in today’s energy management and the larger role it can have in a mix of renewable energy management. The fact that solar energy storage beyond a few hours may not be economic is not an issue, as off-peak power demands are much lower and easily managed by a mix of wind, geothermal and hydro. Where a significant portion of wind energy would be an issue is in daytime summer peak demand periods(1pm to 7pm Nov to Feb in Australia). This is exactly when CSP would make the maximum contribution.
Ted’s hypothetical 33% wind ignores data available now with the limited 13 wind farms data. The capacity factor is 35% and peak power is never more than 70% capacity even in the very small geographic coverage( 1300km x700kmfrom Pt Lincoln SA to Gunning NSW). Weather systems take about 24 hours to cover this region and low wind events last about 24 hours so any expansion within the NEMMCO grid either 600Km West of Pt Lincoln,SA, 200km South of Woolnorth TAS, or 800km NE of Gunning to NSW/QLD boarder and the construction of wind farms in Northern Queensland, is going to even-out near future wind power, while conversion of the NEMMCO grid to a National grid with a connection to WA would provide even more reliable wind power output.
How about siting energy intensive industry next to a solar field (an aluminum manufacturer, for instance) and match production to availability of solar?
A related question is how to do summer load following without additional generation. This will become important as summer temps increase and the population ages. To put it bluntly; we’ll all die like flies in a week of 50C. Rather than trying to power new refrigerative air conditioning with CSP it might be easier to accommodate heat pumps into the existing capacity. A new watt of refrigerative AC may cost $1 on the demand side with $6 a watt for CSP on the supply side. However single room air source heat pumps may cost only 25c per watt. That’s based on $1,000 for 1 kw but with a coefficient of performance of 2.5. It could be cheaper to fit every house with a heat pump cool room and work the gas fired generators a little harder. There’s also remote switching of AC, reflective roofs and so on. That is, forget CSP, air condition less.
Ted, Thanks for a clear if pessimistic review of the field. You don’t appear to have considered heliostats / solar tower which would seem to combine some of the advantages of the two methods you review in that they can (somewhat) point at the winter sun, and avoid the long runs of pipe to storage.
Alastair (#8), according to the NEEDS report, http://www.needs-project.org/docs/results/RS1a/RS1a%20D12.2%20Final%20report%20concentrating%20solar%20thermal%20power%20plants.pdf both of these options, heliostats & solar tower are higher cost.
By the way, from my calculations, it is simply impracticable to produce baseload power from solar thermal. The size of the collector field has to be too great to provide sufficient energy on overcast winter days.
The NEEDS report projects we will have trough technology (the least cost option) able to store 16 hours of energy by 2020. But that is based on average annual hours of daylight. In winter we need 18 hours of storage and charge it in 6 hours. And that is on a sunny day. So when might we reach this capability? 2030? But, what about when it is cloudy?
Solar thermal seems to me to be totally impractical at any cost (as a solution to replace coal for baseload generation).
A rough calculation of the cost for a Solar Thermal trough system, with 1 day storage, to meet Australia’s NEM demand, is $8.5 trillion. The system must provide the power requirements on the most overcast day.
To keep this in perspective, recall the cost to do the same job with nuclear was ($0.12 trillion); i.e 170th of the cost!
This is optimistic because I used the storage costs for 7.5 hours, and applied them for 18 hours without any increase in the rate, and I used the same cost rate for the collector field, thus not making any allowance for the technological improvement that would be needed in the 100 times greater length of tubing to maintain themperature in the fluid over the greater length.
I’ve done the calculations with 3 days of storage using the same unit rates, ($4.3 trillion) but the technology seems even further in the future.
I haven’t included transmission in any of these estimates.
My conclusion: forget solar thermal, forget solar PV, forget wind. Furthermore, since these are considered to be the most likely technologies to be viable, it is most unlikely that any of the other non-hydro renewable technologies will be viable. (Hot fractured rock Geothermal may make a small contribution, we’ll have to see).
Before the usual suspects come back with suggestions of other possibliities, can I urge you to do some calculations on what you are proposing. David Mackay’s book, referenced on this web site, and accessible on line, explains how to do all the calculations. David Mackay summariseds the purpose of his book, in the first sentence of the Preface, as “To reduce the emissions of Twaddle”
I’ll repeat that in capitals “TO REDUCE THE EMISSIONS OF TWADDLE”.
The Holy Grail of clean energy economy is in sight: Affordable storage for wind and solar:
http://climateprogress.org/2009/08/31/clean-energy-storage-wind-solar/
Is “not additive” the new term for being complementary?
David Benson (#10): The Holy Grail of clean energy economy is in sight: Affordable storage for wind and solar:
http://climateprogress.org/2009/08/31/clean-energy-storage-wind-solar/
Wasn’t this technology reported in Scientific American and analyzed here in past posts as being untested, to costly or impractical?
If so then I did NOT see that post but remember seeing mention of it in recent threads and remarks to the effect that the (Sci Am) analysis of this technology was basically bogus/propaganda. Please correct me if I’m misinformed.
Have to provide refutation to the propoganda above — perhaps the researchers can do some research
Let’s look at Longreach Queensland.. We’ll use a Solar 220 from NREL and adjust it for air cooling so it’s a 217MW unit
12 square kilometres (although with new esolar small form factor mirrors can be reduced to 9 square kilometres.
Solar 220 http://www.nrel.gov/csp/pdfs/34440.pdf with 8700MW deployed locally levelised cost is USA 3.5cents per kilowatt hour.
One Solar 220 plant – 217MWe AU$772 Million
Longreach Queensland Solar Data using Azimuth and Elevation tracking for instance..
kilowatt hours per day per square metre
jan 6.63 feb 6.36 mar 6.63 apr 6.54 may 6.38 jun 6.61 jul 7.05 aug 7.3 sep 7.54 oct 7.05 nov 7.18 dec 7.13
Torresol’s first plant to be completed by mid 2010
http://www.youtube.com/watch?v=QN-8DMZLpyI
Solar Reserve
http://www.youtube.com/watch?v=-hu4nrcXxm8
But as usual the Behaviouralists and pro Nuclear Zealots will ignore the evidence
Concrete Steel and Glass wins and provides equivalent power in winter as summer when using azimuth and elevation tracking.
And with the Three Gorges of Air at 50% of the cost of the Three Gorges Dam for 200% of the power produced.. There will be nothing cheaper on earth than Chinese Wind Turbines for producing electricity.
Mathew Wright (#13),
I loved this bit “But as usual the Behaviouralists and pro Nuclear Zealots will ignore the evidence”.
So please show me the evidence. Love to see it.
That is the evidence for baseload generation – continuous power through a long period of heavily overcast conditions in winter.
Do show. I can’t waite to see the “evidence” from a Solar Zealot!
I was a Solar Zealot until I became an Arithmetic Zealot which is why I’m now a Nuclear Zealot.
Is it just me, or does the link to “read his full 44-page set of arguments” not display the images?
Somewhat tangential, but interesting: I wonder what’s become of this technology developed by Tareq Abu-Hamed and colleagues a couple of years ago. It seemed a very nice closed-cycle solution, if practical, to the whole car problem, and the primary energy source was solar thermal-like: not electricity generation, but direct heating of boron oxide to produce metallic boron.
Matt Andrews writes
Direct heating doesn’t get you anything but hot B2O3. That’s typical of oxides of high-energy fuels; they wouldn’t be high-energy if it were otherwise.
This is what Karni, Abu-Hamed, and Epstein proposed. Start with solar electricity, then do DC electrolysis of molten magnesium chloride.
Mix small particles of the produced magnesium metal with pulverized B2O3, heat them until they do solid-phase combustion (like thermite). After the products have been cooled, dissolve away the product with hydrochloric acid.
(How fire can be domesticated)
Given the massive cost of retolling cars and the priority on getting rid of coal it would make more sense to use the boron as a storage medium for stationary energy from solar, assuming round trip efficiency were high enough
Sorry the paper from Morrison is for Linear tracking systems – they do not do elevation tracking — the basis for your argument is floored and you are misleading the readers of this site. Please find a reference for central australia solar incidence based on azimuth and elevation tracking — not just a case that suits your agenda.
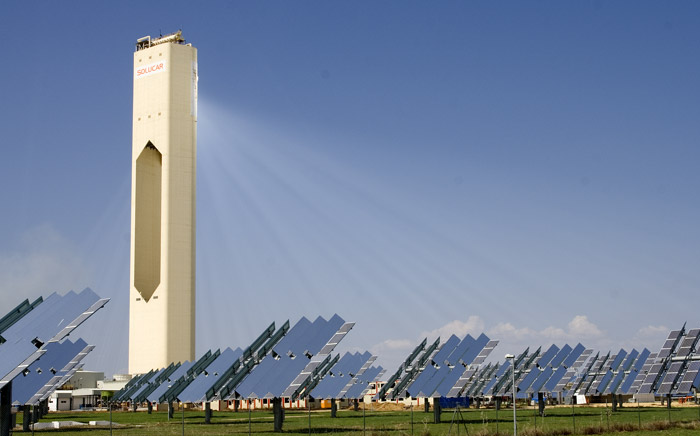
As any budding astrologist will tell you — the sun in winter sits lower in the northern sky (australia) making elevation tracking (power towers do it – such as the photo above) much more suited to provision of winter power.
In locations such as Queensland more power is produced in winter than in late summer.
Put up with a paper that shows such low output with azimuth and elevation tracking systems.
Correction, by “dissolve away the product with hydrochloric acid” I meant “dissolve away the MgO” with that acid. The other product, boron, does not dissolve.
Fran Barlow said
Per unit energy potentially storable by dissociating it, B2O3 is extremely light — per gigawatt-day, 5090 tonnes — but not all that cheap, ~10 million.
So it makes sense as a connection between an energy source and an energy sink that are far apart. Where petroleum bulk marine carriers use, as I recall, 1.6 percent of their energy to go 10,000 km, equally efficient B2O3 bulkers would use 4 percent.
Magnetite, 17.5 times heavier and much cheaper, and partially deoxidizable by simple heating, makes sense for stationary storage. Heap up FeO in the summer, change the heaps back to Fe3O4 in the winter.
Part of getting rid of coal is ensuring that when China and India contain as many privately operated cars as now the whole world does, they aren’t fuelled by coal-to-liquids plants.
(How fire can be domesticated)
Sorry the paper from Morrison is for Linear tracking systems – they do not do elevation tracking — the basis for your argument is floored and you are misleading the readers of this site. Please find a reference for central australia solar incidence based on azimuth and elevation tracking — not just a case that suits your agenda.
Here we go again. I went through this for the benefit of others a week ago in post #253 in the solar power realities thread. Using US data on fixed arrays and tracking arrays the increased output is trivial and makes no real difference to the final numbers, or to the policy implications. Check my numbers for whatever US location you desire (a good US calculator is referenced). Check the numbers for whatever month you care to look at. The upshot is that there is a small increase in output, perhaps 30%, which is not relevant when you’re chasing orders of magnitude improvements. The same considerations will apply to oz.
John — Well Longreach Queensland 6.5kwh per day — prove me wrong
WE’re using data from Australian sites — cause this is Australia.
that’s 6.5kwh per day per square metre in the middle of winter
Mathew Wright,
Do you understand the difference between energy (kWh) and power (kW)?
The fact that the solar plant can produce 6.5kWh per day proves nothing.
How much POWER can it produce, to exactly match demand, 24 hours per day, 365 days per year.
It must be able to produce the power that we demand, at all times. Our demand fluctuates a bit, but we still demand power all the time.
To give you a perspective of how much power we demand, on average, maximum (peak)and minimum (baseload), here are the figures for the National Electricity Market for July 2007:
Average power demand: 25 GW
Baseload demand: 20 GW
Peak demand: 33 GW
The minimum demand occurs in the early hours of the morning. The peak demand occurs at about 6:30 pm in winter.
The solar plants must be able to supply POWER to meet the demand at all times.
How will the solar plant provide the POWER demanded through the night, through periods of cloudy weather in winter when we have at most 6 hours of effective generation time?
You can do the calculations yourself. Or read the paper “Solar Power Realities”. Solar Thermal is much worse than Solar PV. See the figures for solar thermal on the “Solar Power Realities” thread, comments #304 to #308.
Please excuse a non technical comment, but there is the not so faint whiff of zealotry in the air on this post…. which does this site no favours at all.
Given the challenge, if we don’t fully understand the technology we need to find out rather than try and know another possible solution.
Unfortunately with the best will in the world Australia won’t get a IFR running within 10 years so we should ensure we understand how solar thermal works in the real world in the meantime. We know that at least it can replace some coal on hot summer days and might do rather more.
Cherry picking examples is what deniers do!
I wonder if it helps to distinguish between the predictable winter peak demand and the unpredictable summer heatwave demand. After record winter rainfall Tasmanian dams are 43% full so no doubt there will be lots of hydro peak assist this summer, limited to .5 GW by the Basslink HVDC cable export capacity.
Since there is no guarantee that renewables will cover peak demand in either cold snaps or heatwaves I think much of the solution must be demand management. That could mean time-of-year energy pricing, supply rationing and customer techno assistance. The practical implementation ranges from mild to draconian. I know for example Adelaide’s ETSA power company wants to use remote switching of air conditioners but knows it will be unpopular.
http://www.etsautilities.com.au/public/download.jsp?id=7515
Peter#26, Matthew #13 ,
Matthew has demonstrated that Northern Australia does receive considerable solar energy(6.5kWh/m/day) in winter. The CSIRO web site shows very large regions of high winter solar energy across N Australia.
The issue is “can solar(CSP) provide considerable power to a national grid, even in winter” The answer is yes, but not 100%.
Ted Trainer looked at a 33% wind, 33% CSP, 33% PV scenario.
Peter,
The winter daytime peak is small but the summer daytime peak is the critical value and when we presently have supply problems. Solar CSP with 3 h storage( a more economical use of turbines) would produce maximum power at this time. CSP located in both SW Australia( very low summer cloud) and NE Australia( cloudy in summer but not in winter) would provide reliable solar “peak” power( not for 100% 24 hours a day) but probably about 50%-70% of summer capacity would be firm power from 10am to 7pm(ie the “peak” market.) 365 days per year.
Similarly for a continent wide spread of wind power( Geraldton , Esperance, Ceduna, VIC, TAS, NSW highlands and Cairns to Cape York) is likely to provide >15% of capacity as firm power.
At most would need 12 hours average power back-up( 300GWh at present consumption) for cloudy low wind days in SE Australia.
In the next 30 years we are still going to have mothballed coal fired power plants, and are still going to be using NG. We have considerable pumped hydro resources that could be used for 6-24 hour back-up.
I maintain we will not “overbuild” any power resource, either solar, wind or nuclear because we have ample low cost back-up resources available. We are not going to build an extra 5GW of nuclear for the 3h peak on extreme hot summer days in SE Australia and power down for 7,500 hours during the rest of the year.
It’s more important to phase out 95% FF as fast as possible rather than the final 98% or 99% carbon free status.
Nuclear can contribute to this but cannot alone reduce FF use by 95% in next 20 years. A mixture of nuclear, solar and wind energy can achieve that goal.
Beyond 2050 many options may be possible, but if we are still burning significant amounts of coal without CCS it may be too late.
Mark (12) — Several different technologies are treated in the linked paper. At least one is out for bid to be constructed.
Scientific American? While I haven’t received the September issue yet, I don’t recall anything about these ideas in earlier issues.
A modest but useful suppliment to natural gas is biomethane produced in anaeorbic digesters and then cleaned sufficiently to introduce into the natural gas supply. Every village, town and city in the world ought to be doing this using sewage sludge as the biomass.
To put in perspective, the USA currently has stored (underground) about a 4 day supply of natural gas; natural gas fueled power generators cycle up and down quickly, making good load following units. Wind and solar with natural gas backup will work just fine.
This underlying assumption seems to me to be the elephant in the room. A bit of thought suggests that it may be a faulty assumption.
It is true that our current electrical system is set up to supply and demand a relatively constant level of power. Indeed, control mechanisms (eg off-peak control and pricing differentials) act to push the demand into a more regular level. Why is this? Of course, it is because the current generation system works best if it can be run at a constant level. So to a significant extent the ‘constant demand’ is a product of the needs of the current generation system.
However, this was not always the case. Before large-scale electrical supply, energy was produced, and consumed, intermittently. Storage occurs naturally in fuel-based energy supplies, and typically significant storage exists at the consumer end of the energy system. If the electrical system had similar delivery constraints on it (ie intermittent delivery or large temporal variations in pricing) then consumers would soon enough alter their consumption patterns and install local storage to accommodate such variability.
My suggestion therefore is that the assumption of steady demand / supply is not necessary for a future high-capacity energy system. It is merely something we have grown used to (and, I might add, a convenient point of argument for proponents of nuclear energy versus solar/wind).
There are several feasible ways for the demand side of the energy system to be moved towards a more ‘non-constant’ state. One is of course by means of load regulation (ie equivalent to the present controls of off-peak heating and other ‘non-time-critical’ usage). This may require more utilisation of on-site energy storage such as larger water cylinders or heat (cold) storage for temperature control. Another is developing altered pricing mechanisms that better facilitate variable demand. And of course there is behavioural change.
Neil Howes, (#29),
You lost me at line 1. Where do you get the idea that the summer peak is higher than the winter peak?
Refer to the “Solar Power Realities” paper, figure 1.
Also, this doesn’t make sense: “would provide reliable solar “peak” power( not for 100% 24 hours a day)”. What is reliable power, if it’s not 100% of the time?
If’ its not 100% of the time, then we have to have two systems, and the capital cost for both. All the renbewables can do is save some fuel. The GHG savings are negligible.
All this is explained in the Solar Power Realities Paper and the wind power.
You say we have plenty of hydro-pumped storage capacity. If you mean at unmlimited cost that is true. At any reasonable cost we do not. The comments I posted yesterday aboiutTumut 3 should explain that. Even Tumut 3 and Blowering are not viable. We could double the power to 3 GW, but there is no way that we could pump the water every day to provide 3 GW of power during the night.
The whole idea is totaly absurd. If you and the others positing all these hair-brained ideas would just do a few calculations you could work it out for yourself.
Peter#32,
Record power demand has been on hot summer days, requiring power shedding in Melbourne and Adelaide( late Jan 2009, initially industrial customers and finally rolling blackouts). While I lived in SA, out plant often went to standby NG powered diesel generator during peak demand periods in summer, because we were buying “non-firm power” I don’t have the figures for WA but would expect they also have a demand peak in January, with some load shedding by industrial customers. Some big energy users shut down operations during these periods.
If solar is providing peak power it only has to be reliable during peak demand not during off-peak times. If you want to argue that we have to have 100% of power from solar and cannot have any load shedding or any hydro back-up that’s a different issue, Ted and you are saying that renewables are not additive(or complementary).
Your quote:
“If’ its not 100% of the time, then we have to have two systems, and the capital cost for both. All the renbewables can do is save some fuel. The GHG savings are negligible.”
We already have very significant NG and coal capacity. It’s all about “saving FF”. Your thesis that “GHG savings are negligible” is based on faulty assumptions about wind and solar, such as we derive wind from a few sites within 1300km(most within 400km) and solar is ALL located in regions of low winter solar energy and high winter cloud cover.
Using existing FF back-up only 1-5% of the time is going to give >95% GHG reductions.
I don’t think you have provided any figures for the cost of pumped hydro modifications of existing dams( ie turbine costs rather than purpose built pumped hydro figures or 1967 figures of <$64Million for 9GWh at Tumut3).
I think the cost of adding pumped hydro capacity would be as low as $5-10million/GWh storage, but would welcome more recent figures for hydro turbines.
Again ETSA provides some numbers on peak demand
http://etsautilities.com.au/public/download.jsp?id=7517
South Australia drew over 2.8 GW on 17/3/08 for about 1.1 million people. They claim to have some of the world’s ‘peakiest’ demand, and by coincidence a third of the world’s uranium.
On pumped hydro I speculate that it could be a lot cheaper to link closely located wind turbines and hydro discharge pond water pumps with direct current ie not AC driven reversible flow water turbines. It might work out cheaper than other ways of finding RECs if targets get serious.
G.R.L. Cowan, H2 energy fan ’til ~1996@22 said:
Extremely doubtful development in my opinion. We saw at Beijing 2008 that the Chinese government was willing to adopt outlandish measures at great cost to cut urban smog and moreover they are going full bottle on developing e-vehicle manufacturing. Finally, why would they do anything to underpin the price of coal on which they are otherwise so reliant? It makes no sense.
By the time crude oil derived fuel gets expensive enough to make coal competitive, most commuter vehicles will be electric.
It makes much more sense to focus on replacing coal with anything cleaner, as liquid fuels right now in the advanced economies contribute far less than does coal and are in any event, a lot more finite and expensive ber BTU.
Any Chinese residents reading this? How many more oil-burning cars are there now in Beijing than there were a week after those “outlandish measures” ended? How many more EVs? How many important government officials have you seen in EVs?
Sigh. Will the commuters be required by government to stop buying heavily taxed motor fuel, Fran, or will they adopt EVs voluntarily, as you no doubt have already done, because it’s the right thing to do even if gov’t doesn’t like it?
— G.R.L. Cowan, (‘How fire can be domesticated’)
http://www.eagle.ca/~gcowan/
Neil,
Aren’t you being a bit inconsistent.
You said: “Record power demand has been on hot summer days, requiring power shedding in Melbourne and Adelaide( late Jan 2009, initially industrial customers and finally rolling blackouts).”
These are local peaks. The peak on the total NEM grid is in July at about 6:30 pm.
The whole argument about renewables is that you have a fantastic grid so that it doesn’yt matter whare the power is generated, there is no problem getting it to the demand centre. That is the principle underpinning distributed wind power and distributed solar power (“the wind is always blowing somewhere”. Someone even posted that we could connect the Eastern States to SW Western Australia with a transmission line so that if the wind is blowing over there, there is no problem.
It is very difficult to have any sort of meaningful debate when the goal posts continually change, and peole will not calculate the cost of their proposals.
John — Well Longreach Queensland 6.5kwh per day — prove me wrong
I’m sure you’re right, its just not relevant.
WE’re using data from Australian sites — cause this is Australia.
Unless the US is orbiting a different star (sometimes I wonder) or geometry is different in Australia, again, it doesn’t matter.
You contend that using troughs and ignoring 2D tracking is “misleading the readers of this site”. That contention was also made by Stephen Gloor and EclipseNow in this thread. I addressed that concern in some detail in this post. Gloor and Now were then gracious enough to acknowledge that considering tracking arrays did not affect the analysis. Its been dealt with, and continuing to claim it makes a difference is “misleading the readers”.
“As any budding astrologist will tell you — the sun in winter sits lower in the northern sky (australia) making elevation tracking (power towers do it – such as the photo above) much more suited to provision of winter power.”
A pity then that “solar power towers” blow chunks. A lot of very smart people working for the DoE couldn’t even build one in the Californian desert that could be profitably operated once it was _already built_. Without subsidies the cost of maintenance and repair of the heliostats was higher than what the energy the original solar one produced(don’t confuse it with the solar one through design).
As soon as EVs — the plug-in type — arrive here I will be buying one, along no doubt with many others, and I don’t doubt the same will apply in China and India. China, India and Australia are all net oil importers and do it would make sense, especially in China and probably in India, who have the domestic market to make manufacturing them viable.
Time for a catch-up whilst waiting at Changi Airport!
David #10 — the main proposition there is compressed air storage, which cannot ever be economic due to its extremely low energy density (and the fact that it must be heated to be used)
Mark #11: if you mean ‘not complementary’, then I suppose it is, yes
John M #15: agreed, that’s me too
Gaz #16: The figures on Trainer’s website show up okay for me (there are not many though)
Matthew Wright: Fortunately Peter Lang and John Morgan have already taken the time to answer you, perhaps more patiently than I would have. Given that our previous exchanges on other threads of BNC degenerated to the point of you calling me a ‘purveyor of poison’ for supporting nuclear power, it’s quite some gall you have to call me the zealot
GRLC #22: So you see a possible mix of metal energy carriers — iron for stationary uses because it’s cheap, and boron for mobilility?
Alastair #27: Where is the zealotry and cherry picking? This is certainly not the intention. We are working through the numbers. If you have the quantities which show where items in the above posting or subsequent comments are wrong, please show them and we’ll be happy to discuss.
Neil #29: I don’t see that reducing FF use in Australian by 95% in the next 20 years is possible with any technology, but it is possible within 40 years
William #32: Agreed, demand management will be important, as will energy efficiency. These will all help reduce the job required for decarbonisation. But they won’t, in and of themselves, go far towards fixing the key supply issue — this demands a reliable, dispatchable power source that is cheaper than coal. If we can’t achieve this, whether it be via new nuclear+storage or renewables+storage, we’re collectively hosed.
John N #35: Might work, but you’d need those turbines pumping 24 hours a day, rather than being used to generate electricity directly, to make it feasible — in which case perhaps mechanical wind pumping would be preferable.
Yes. More or less. The charged and discharged states iron would annually go between, respectively Fe~3.7O4 and Fe3O4, would be neither of them metallic. So really, no metals. And the FeO, by not going anywhere, would be more of an energy deposit than a carrier.
The significant cheapness is not that of iron but of magnetite, Fe3O4, which is an iron ore.
(How fire can be domesticated)
Barry, renewables not complementary?
So they are neither additive (Trainer’s term) nor complementary (Howe’s eg below)?
http://bravenewclimate.com/2009/08/16/solar-power-realities-supply-demand-storage-and-costs/#comment-25537
Do they cancel each other out?
😉
Mark, to be more accurate they’re everything! Sometimes additive, sometimes complementary, sometimes not delivering across the board. That’s kind of the problem — they can’t just stick to one thing.
Barry Brook (42) — The article mentions two CAES which have been in operation for decades. The article points out that wind powered CAES would cost 13.5 US cents per kWh for fully dispatchable power (wiothout incentives); that appears to be cost competitive with other fully dispatchable methods.
It does require heating. That might be supplied by pyrolysis liquids or even biogas from anaeorbic digesters; does not have to be natural gas or biomethane, the non-fossil equivalent.
Of course CAES can be used with any energy supply, such as night time nukes.
David B Benson,
You say: “Of course CAES can be used with any energy supply, such as night time nukes.”
If you are going to build nukes, why wouldn’t you use them 24/7 to provide all the power requirements? Why would you build solar and wind and CAES as well as the nukes?
Peter Lang (47) — CAES is one way to provide dispachable power to meet the instantaneous demand. The general shape of the demand is low during late night and rising to a maximum about 3 pm or so, then lowering once again. Nukes are not good at this sort of load following and certainly cannot be adjusted to meet the sudden changes which occur during World Cup football (soccer in the USA) games when a home team is competing; wild fluctuations at half time, for example.
To meet the changing needs there has to be immediately dispachable power. In addition to rotating reserves to meet the most rapid fluctuations there need to be ways to hourly adjust to meet, approximately, the changing demand. Currently this is done largely with natural gas fired units which come up and go down quickly and easily or with hydro where available. CAES does the same.
So nukes and big dirty coal plants just crank along generating the same amount of power all the time. Utilities have to beg companies to consume the nighttime energy in some localities. Instead the nukes could be charging up CAES or pumped hydro in locations where that is possible.
But large CAES means that any electrical energy source will suffice, wind, solar, nuke, whatever. The CAES provides the buffering between input (whenever provided) and output (when needed). Large storage dams do the same for hydro, CAES not being unique in this regard.
David, the three huge problems with CAES (compressed air, for those not up with the acronym) is: (1) it has a low energy density (about 2-5 kWh/m3 depending on compression — higher values result in lower conversion ratios), (2) the conversion losses are high (see 1), and (3) it requires heating for it to generate power. The implication of 1) and 2) is damning for volumes, and 3) requires burning gas. Trainer described the problem well:
“To retrieve the 670 MW x 16 hrs night time output from a 1000 MW power station, i.e., 10,560 MWh, would require storing about 17.6 million kWh. System cost would have to include the cost of the compressors and the turbines for generating electricity from the air (possibly the same devices), and the cost of the storage caverns. This means that for each 1000 MW power station providing the energy to be stored we would have to build another capable of generating 660 MW at night from the compressed air. (The compressing turbines might be reversed and also used as generators.)
Very large storage volumes would be required to store significant quantities of energy. Sorensen (2000) says 15 MJ can be stored per cubic metre, i.e., 4.16 kWh. Therefore to deliver 10,560 MWh to meet night time demand from a 1000 MW plant via a 0.5 efficient system would require a storage volume of approximately 8,460 million cubic metres, i.e., a mine shaft around 8,460 km long. There would probably be too few caverns or old mines large enough for this form of storage to enable bulk electricity supply via intermittent sources. Excavation is economically feasible for heat storage in water but much less so for the larger volumes required for compressed air storage.
The biggest problem would seem to be the fact that high efficiency requires the addition of heat via gas burning at the regeneration stage. In a wholly renewable energy world this will not be possible. Solar heat could be used, but this would mean solar plant would have to be added to collect energy in the form of heat equivalent to a large fraction of the energy collected as wind, and the plant to store it would also have to be built. Heat availability would be at its lowest in winter when wind energy for storage was at its highest.”
It doesn’t seem even remotely feasible, and yet people like Joe Romm continue bang on about it without doing the numbers.
Brook quotes Trainer:
The actual quotient is 5.077 million cubic metres.
Does anyone take Trainer seriously?
— G.R.L. Cowan (‘How fire can be domesticated’)
http://www.eagle.ca/~gcowan/
Trainer clearly meant 8.46 million cubic metres, because this volume would require a mineshaft of 8,460 km in length if its area dimensions were 1m x 1m.
But Graham, thanks, you spurred me to redo his calculations:
Energy density is 4.16 kWh per m3, so if a mineshaft has height x width dimensions of 1.5 x 1.5 m, then 1 m length of shaft would store 2.25 m3 or 9.36 kWh.
Trainer said that to retrieve 10,560,000 kWh required storing 17.6 GWh — this implies a compressed air to electricity efficiency of 0.6. On this basis, one would require 1.8M m of mine shaft, i.e. a mine shaft 1,880 km long — much less than his estimate of 8,460 km, but still huge.
But why the conversion efficiency of 0.6? Mackay says it is 0.18 for the full compression/decompression-generation cycle. If you assume half of the losses goes into compression and the other half into decompression-generation, that’s a 0.42 efficiency for each step, and you’d therefore need to generate 60 GWh to store ~25 GWh to retrieve 10 GWh. The 25 GWh of compressed air energy storage (CAES) would require a mineshaft of ~2,700 km long.
The 4.16 kWh/m3 energy density appears to be an optimum — I’ve seen the figure of 2 kWh/m3 more often used, which would double that mineshaft to over 5,500 km long — kind of closer to Trainer’s figure.
Indeed, if you use a mineshaft dimension of 1 x 1 m, storing 25 GWh requires 6,000 km at 4.16 kWh/m3, or 8,400 km (Trainer’s figure) at 3 kWh/m3.
Out of curiosity, where did Trainer get the 8,460 figure from? If you multiply 17.6M by 0.5 you get 8.8M so perhaps he did this? I think he got mixed up here, but as you can see by the above, the gross conclusions don’t alter much.
So yes, I take Trainer seriously, but take the message that I should probably always redo the calcuations myself, just to make sure.
John Newlands suggested that we save summer demand energy by resorting to the use of air source heat pumps. John appears to be unaware that air conditioners. – with the exception of evaporative chillers – are nothing other than one way heat pumps. Some heat pumps are designed to both heat and chill, but most only chill.
Barry Brook (49, 51) — I disagree. (1) Newest facility is to use 1500 psi in existing limestyone cavern. See link. (2) “The current estimated cost of such a facility is in the range of $700/kW with energy conversion efficiency in the range of 80%.” from
http://www.xcelenergy.com/SiteCollectionDocuments/docs/AppendixE.pdf
which a comparable efficiency to most pumped hydro. (3) Does not have to burn gas, simply needs heat from some source. I previously posted some alternatives to natural gas.
The fact that utilities continue to build CAES strongly suggests that such units have a (small) role to play. As additional intermittent generators such as wind and solar are brought into operation I suspect we will indeed see more CAES also being constructed in localities without pumped hydro potential.
@Charles B
fair point but the general idea I’m getting at is that summer cooling could be rationed in different ways. For example every adult could limited to say 100 cubic metres of thermal comfort space, cooled or heated the cheapest way possible. If people want to watch a large plasma TV in that cool space they don’t get any extra wattage. In Australia temperatures range from -6C to 46C. Make that 20-30C inside the 100 c.m. entitlement or perhaps a limit of 500 watts per person (I need to recheck the figures). 150w evaporative coolers will struggle with increased humidity. If people want more they should pay a premium electricity tariff.
Even though I use pseudo-renewable energy like wood fired heating in winter I see how limited an option that is. Therefore I rank dispatchable power and demand management higher than renewables.
Regarding CAES, ths is what the Electrcity Storage Association says:
http://www.electricitystorage.org/site/technologies/caes/
David B, it’s unclear from the doc you link to (not enough info, the only useful bit for CAES is pg 13), but it seems they are talking about the efficiency of generating electricity from the compressed air as 80% — perhaps that is why they reference the power of the planned facility (a 2700 MW plant) rather than the amount of energy that will stored in the limestone cavern (how many MWh? — they don’t say).
So it may not actually relevant at all to what I wrote below, except it could make the problem worse, because if the total efficiency is 0.18 as Mackay says, and the efficiency of the compressed air to electricity step is 0.8 (when you add natural gas burning), then it implies the combined efficiency of the other steps is closer to 0.23, which would mean trying generating 108 GWh of energy in order to store 25 GWh, rather than the 60 GWh I had supposed before. Dunno, need more information.
I suspect the utilities are building this CAES to even out the 5 to 30 min fluctuations in wind, in which case the energy storage problem is not really all that bad, as the cavern could be relatively small and still do the job. I’d like to know more. For instance, to even out 2.7 GW of peak wind power (the power of the cited facility) for a period of 30 min would require storing 15 GWh for a 0.18 efficient system, which could be done in a cavern of 100 m x 100 m x 160 km at 4.16 kWh/m3, which might be possible.
A high PSI they cite implies a greater energy density that 4.16 kWh/m3, but surely the cost of compression means the conversion efficiency reduces as a result? Do know, need numbers!
The idea of dissolving salt domes to create the new caverns is certainly a neat idea, but geographically, the options would be rather limited.
Regarding CAES, this is what the Electricity Storage Association says:
http://www.electricitystorage.org/site/technologies/caes/
The important point to note is that the analysis presented in ‘Solar Power Realities’ is a ‘ball park’ analysis – e.g +/-50% say.
CAES will sometimes be cheaper than pumped-hydro and sometimes pumped-hydro will be cheaper. It will depend on site conditions (topography, hydrology and geology for pumped-hydro, and geology and perhaps existing suitable mines for CAES). But the difference in the total costs presented will be insignificant by changing from one technology to the other. I used pumped hydro for the analyses because it is more familiar to more readers – we have some sites in Australia already, eg Tumut 3. You will notice that CAES is considered in the ‘Solar Power Realities’ paper – see page 8 and also the footnote #13.
Barry Brook (56) — The link provided by Peter Lang contains much the same info in a more convenient form. It also adds that the turbines spin up in 14 minutes, which makes having such a unit to handle load (or supply) fluctuations quite valuable.
I think that the 80% efficiency means, as it does for pumped hydro, that 20% of the input energy is lost. I don’t see storage density as an actual issue any more than it is for pumped hydro.
Peter Lang (57) — Thanks for the useful link. Could you also link to the ‘Solar Power Realities’ paper? Somehow I missed it.
Both: A special subscriber only issue of Scientific American contains several papers regarding Energy’s Future. The first is by nuclear scientist/engineeers James A. Lake, Ralph G. Bennet and John F. Kotek, all at INEEL. Still reading it, but impressed so far.
David B Benson #58, to get to the Solar Power Realities paper scroll to the top of this page and click on the “started here” thread.
I didn’t realise you hadn’t read the background. I wonder how many others haven’t.
The papers build on each other. The four papers/articles are:
1. Cost and Quantity of Greenhouse Gas Emissions Avoided by Wind Generation
2. Wind and carbon emissions – Peter Lang Responds
3. Solar Power Realities
4. Solar Thermal Questions
5. A new paper due any day
Peter Lang (59) — Thanks, I read your pdf. I’ll think about it and respond later. For now, I quote
“He who does not learn to store
shall have no power after four.”
David B Benson #60,
Your poem is spot on, but much more if we have to use renewables.
You may be interested in the recent comments about storage and transmission costs on the Solar Power Realities thread, if you haven’t been watching that thread.
Re CAES and large storage volumes. There are existing deep storage facilities (ie natural gas fields) that have been storing gas under pressure for many years now and could be re-used for large scale compressed gas storage. Of course there are some issues – you’d need to use relatively small fields with good flow capability so you could get the pressure in/out quickly enough – but it is another option in addition to the salt caverns.
William Thorpe,
I agree. But what it really boils down to is the $. What are the costs?
Renewables plus storage are too costly by orders of magnitude. This is the key point.
It’s all just arm waving if we don’t work out the cost estimates for the proposals.
Peter Lang (61) — Alas, not my doggerel; that’s why it is in quotation marks.
I agree that solar PV is currently far too expensive to even consider. Solar thermal seems to currently have a role to play in Southern California with peak load, due to A/C, in the afternoons.
To simplify the eastern Oz grid situation, assume every day is exactly the same, a sinusoidal variation peaking at 33 units from a minimum of 20 units. Assume this demand is inelastic and muct be met. Since large steam generators need to run constantly 24/7, it is probably most economic to think of 20 units supplied by nukes. What about the 13 units of daily variation?
For those 13 units, some form of storage is going to be far more economical than building another 13 units of nukes. Vastly more. From the link in my comment #10, while the underground pumped hydro is going to cost billions of US$, its design life is 100 years. In effect this peak shaving unit is free but for the low cost electricity it consumes to later generate high cost electricity during peak demand. So I’ll simplify by assuming as much free, environmentally benign, close to consumption, 80% efficient storage as is needed, 8 units worth (input). These 8 units are energized during the bottom half of the daily cycle and drawn down during the other half if the 8 units are provided by 8 more nukes; total nukes stands at only 28, not 33.
Can one do better using intermittent power sources such as solar or wind. Yes, although then probably a bit more storage is required, but I will ignore that. Instead we start with
Busbar costs of electricity:
http://www.ethree.com/cpuc_ghg_model.html
Busbar (generation) cost in cents per kilowatt-hour in 2008 dollars:
Biogas: 8.552
Wind: 8.910
Gas Combined Cycle: 9.382
Geothermal: 10.182
Hydroelectric: 10.527
Coal Supercritical: 10.554
Coal Integrated Gasification Combined Cycle (IGCC): 11.481
Solar thermal: 12.653
Nuclear: 15.316
Biomass: 16.485
Coal IGCC with Carbon Capture & Storage (IGCC with CCS): 17.317
to see that we want to use as much wind as possible, followed by solar thermal. (as modified by additional transmission costs).
But what if the wind does not blow and the sun does not shine? We’ll either need lots more storage, which is then far from free since it is rarely used, or we fire up the old gas turbines, using stored biogas and even natural gas. I stress old because these are paid off units nearing the end of service life. Even if not terribly efficient it matters not as use is exceptional.
Cost of biogas production is considered o be comperable to typical natural gas prices. (Right now natural gas in the USA has an artificially depressed price.):
http://biogas.ifas.ufl.edu/FAQ.htm
David B. Benson (#64).
Thank you for this post. Many interesting thoughts.
I am not sure if you read the other papers about wind and solar power on the BNC web site. There are two other papers to come about solar thermal and transmission, which may help with some of this.
You said “Since large steam generators need to run constantly 24/7, it is probably most economic to think of 20 units supplied by nukes. What about the 13 units of daily variation?”
The basis of the costs in the solar power realities paper is 25GW nuclear and 8GW energy storage (I used pumped hydro for the calculations but could equally have used CAES – which is used in practice would depend mostly on what sites are available, which is cheaper and environmental impacts).
You said” “For those 13 units, some form of storage is going to be far more economical than building another 13 units of nukes. Vastly more.”
If the full 33GW was supplied by nuclear, i.e. without energy storage, the cost of the total generation system would be about 10% higher than with 25 GW from nuke and 8 GW from energy storage. So, definitely not “Vastly more”.
Coal and nuclear can load follow to the extent of your daily sine wave, and in fact faster than that. It just depends what they are designed for. The NSW and Queensland black coal fired power stations do have considerable load following capability, so I understand. Regarding nuclear, you may have missed the earlier post where I pointed out that the nuclear reactors can load follow, it simply depends on whether they are designed to do so. For example, the European Pressurised Reactor (EPR), which is currently being built in Finland, France and China and I understand is ordered for UK, Italy, India, can ramp its power output at a rate of 80MW per minute.
“EPRTM reactor can be operated at any power between 25% and 100% of nominal power in a fully automatic way. Usual load follow possible at 5%/min between 60% and 100% nominal power during 80% of irradiation cycle.””
http://www.areva-np.com/common/liblocal/docs/Brochure/EPR_02_09_4vol_en.pdf
You say: “Can one do better using intermittent power sources such as solar or wind. Yes, although then probably a bit more storage is required, but I will ignore that.”
I am not persuaded that this is true. In fact, I doubt there is much or a role for solar and wind at all in a least-cost, low-emissions electrcity generation system. The four papers on wind and solar and two to come explain why I am not persuaded there is an economic role for these technologies. In fact, I believe their role is highly damaging to the economy, is ineffective in reducing GHG emissions, and will make us less able to take the most appropriate actions in the future.
Regarding the cost of power from wind generation I’ve seen two recent analyses:
http://www.quadrant.org.au/blogs/doomed-planet/2009/08/the-costs-of-power
A recent ACIL Tasman study shows that generation costs of nuclear and wind would be about the same in Australia and soalr about twice. However, this is just the generation costs. The cost of back up and transmission is not factored in.
Neither of these studies address the full costs of intermittent renewable generation.
The next two papers will provide more insight – and probably more for us to debate.
Thank you again for your comments. Every little bit helps.
Peter Lang (66) — I used the ethree company figures which were commissioned by the State of California. Whaever (dis)incentives are built into those numbers won’t apply in Australia, of course. But using those, biogas is so inexpensive because the input wastes aree free; growing biomass just to make biogas raises the price. Still, it ought to be able to compete with natural gas for running CCGT. Up to the agricultural limitations, this is the least cost according to the ethree company. Next renewable up is wind, when one can get it. The USA has plenty of windy spots, probably different in Australia. Anyway, it is clear that in the USA there is lots of wind power being installed, over 8 GW of capacity so far, supplimented by CCGT and OCGT, fired by natural gas, as backup.
I fail to understand how only 25 units of nukes are going to supply 20 units of baseload and still recharge 8 units of storage.
I was interested to learn about cyclable big generators. All 103 nuclear power stations in the USA are quite old and none are designed for cycling. In at least the Western grid, none of the large coal plants are, either. I would think, off hand, that cycling big plants would shorten their useful life.
David. B Benson (#67)
I don’t think biogas is main game. I doubt it will be a large component of the generations sytem. There are many, many renewable energy ideas (wave, tidal, ocean thermal, geothermal, bio… etc). But their potential contribution is small and/or they are high cost compared with the front runners. They all have their own problems. Have you read David Mackay’s book “Sustainable Energy Without the Hot Air”? The purpose of the book is stated as “To reduce the emissions of twaddle”. You can access it on line from this web site. Once you’ve had a bit of a look, if you are interested, you’ll probably buy a copy to keep it close at hand. It is well worth reading. It explains the limits of what is available, and how to do you’r own calculations.
You say; “But using those, biogas is so inexpensive because the input wastes are free;”. I haven’t checked the basis of this claim, but I seriously doubt that is true. I doubt this is based on full life cycle analysis.
I haven’t looked at what hidden subsidies and mandatory targets apply in California. I know that the mandatory targets in Australia are causing us to pay 2 to 3 times as much for electricity from wind as for coal, and wind power is not as valuable as that from coal. In fact it is almost valueless. Just ask the distributors. Most of this simply is not realised. We are passing regulations that hide all this. Wind also avoids very little GHG. Nothing like as much as is claimed.
You says: “I fail to understand how only 25 units of nukes are going to supply 20 units of baseload and still recharge 8 units of storage.” Refer to figures 2 and 3 (I think from memory) in the “Solar Power Realities” paper. Notice that baseload is 20GW and Peak is 33 GW. Average power is 25 GW. So 25 GW provides all the power we need. The length of time at 33 GW is less than the time below 25 GW. The energy is the area under the curve. The 80% round trip efficiency of the storage is included in the calculations. From memory the paper explains all of this.
Global Prospects for Wind Energy: Addressing The Challenges of an Intermittent Energy Source
http://www.princeton.edu/~ssuccar/recent/Succar_IACDurban_Oct05.pdf
is excellant!
David B. Benson,
I was going to ignore this comment “I would think, off hand, that cycling big plants would shorten their useful life.” but just can’t let the opportunity slip by.
If that were true, What an powerful reason why we should not have intermittent renewable energy generators. Consider what they are doing to all the other components on the system!
Peter Lang (70) — I suspect that gas turbines have about a 20 year life, being cycled up and down. That’s not due to wind power assist (although wind turbines also have about a 20 year life), but the fact the demand cycles up and down and so gas turbines are brought online, quite quickly, for what is called peak shaving as required.
David B. Benson,
To help me understand what you believe would be an optimum electrcity generation system, and also to clarify it in your own mind, could you jot down what you believe would comprise a system to provide the following:
25GW average power
33 GW peak power at 6:30 pm in July
20 GW baseload power
600 GWh per day
450 GWh between 3pm and 9am.
What would be the components you would assemble for such a system? Where would they be located? How would you provide power quality?
Re # 69, David Benson
I have only had a chance so far to skim the Princeton link which discusses the problems of supplying baseload power from an intermittent source, namely wind. At first glance, it appears that the authors have come to conclusions that are contrary to those of Peter Lang.
Up to now, as a lay reader, I have been largely persuaded by Peter’s case. However, David’s link seems to me to provide the first potentially tangible riposte to Peter’s thesis. I would, therefore, be extremely interested to read a detailed response from Peter which explains where he finds the flaws in the Princeton paper.
This was written in 2005. There are masses of analyses and papers written since then. There is also a great deal of real data being collected on the problems and additional costs intermittent wind generation is causing the gird operators and electricity distributors.
I would refer you, for a start, to the paper “Cost and Quantity of Greenhouse Gas Emissions Avoided by Wind Generation” and the comments on the threads “Does wind power reduce carbon emissions?” and “Wind and Carbon Emissions – Peter Lang Responds”. Also refer to David Mackay’s book “Sustainable Energy Without the Hot Air”. You can access the whole book from BNC web site and go to each individual page if you want to. It is an excellent introduction.
I’d also refer you to the “Energy Storage Options” slide on the link you asked me to look at. Do a quick calculation yourself of the cost of energy storage.
To provide a perspective, we need 450GWh of energy to get us through one night. We can go some nights with no wind. We can go several days with very little wind. Now calculate the cost of 25GW and 450GWh of CAES storage at the cost rates (in US$) provided by the Electricity Storage Association: http://www.electricitystorage.org/site/technologies/
The cost is: $42.5 billion for one night’s storage
According to a commenter on The Oil Drum lead acid storage is over 10 c per kwh or $.1 per 10^3 wh. Sodium sulphur storage is under 10c. Thus battery storage of 450 Gwh could be around 450 X 10^6 X $0.10 = $45 million. Tell me if I’ve lost some zeroes.
John Newlands, #75
You are confusing the cost per kWh capacity with the cost of the energy stored and released per storage cycle. Have a look at the site I gave you and it will all become clear. You need to work out the cost of the storage capacity. We probably should multiply the result by 4 to 6 because the sotrage woill have to be replaced at least that many times during the 60 year life of the nuclear power station (the alternative to renewable energy plus storage).
Douglas Wise (73) — Note the Princeton styudy was only aiming for 90% availability. I doubt Aussies would find that acceptable. Anyway, the suggestion of reading MacKay’s book is a good one.
Peter Lang (72) — That is a challenge, especially as so much has been left unstated. Sill, I’ve been to NSW and Queensland; also looked rather thoroughly at some maps of Australia. So I’ll give it a try.
I’d begin by locating as much (busbar) 3 US cents per kWh wind potential as possible; the US Great Plains is such, but Oz might not have any. Then 4 cent and on up to the cost of CCGT power. I’d considerably overbuild for reasons that will be clear, I hope.
Along the way up to CCGT prices, we pass biogas at a bit less cost according to the ethree study for CA. Use all of that and build many, many algae farms, say out on the Nullarbor Plain, to make more biogas. It might be sensible to refine the biobas into biomethane and CO2, the CO2 going back to the algae tanks. I’ll suppose that. So we will need methane, so-called natural gas, pipelines from the farms to points of consumption, combinations of CCGT units with hydrolysis units. And now we see the point of all that excess wind capacity, available as power on windy days; hydrolysis of pure water into oxygen and hydrogen.
Diatomic hydrogen is scary stuff. If I knew how to safely use biologically derived carbon to do
C + 2H2 -> CH4
I’d do it right away. Good, we have even more biomethane. If that isn’t possible, have a local stationary fuel cell for more power.
The biologically derived carbon could come, perhaps, from biochar. Make the biochar in the outback rather than letting the “bush” burn badly every few years. One also obtains pyrolysis oils which are rather similar to #2 heating oil; burn that to generate a bit more electricity.
Now the neat part: some of the CCGT units (or other steam makers) are to burn the fuel in the stream of pure oxygen made available by hydrolysis. The resulting flue gas consists of almost pure CO2. Some might go back to the algae farms, but I am supposing that most would be sequestered. While there are two ultramafic rock outcroppngs in northwest Australia, it could well be less expensive to use the rock in Papua New Guinea or under the ocean just north of there. In any case, carbon negative sequestration of biologically derived CO2.
If maximum demand cannot be met by the above, some storage might be useful; we have both written about that. Otherwise, using the ethree data, I suggest using natural gas fired CCGT and some OCGT until enough more algae farms can be started out on the vast Nullarbor Plain.
A test of oxy-fuel combustion in a large coal plant was highly successful, so much so that the elvated temperatures generated enough extra energy to run the oxygen producer which might have been cryrogenic. Refit all your coal plants with those and capture the resulting almost pure carbon flue gas; result is almost carbon neutral.
Almost surely more efficient to obtain a 90% ozygen, 10% argon fgas from a Linde VPSA Oxygen Plant (probabley uses an amine sorbant) and then follwed by an argon sorbant treatment if required.
So forget about electrolysis or cryogenics; this isn’t rocket science.
Here is a link (one of many) to
Clean Fossil Fuels
Carbon Capture & Storage | Near-Zero Emissions Oxy-Fuel Combustion Gas Turbine Technology:
http://canmetenergy-canmetenergie.nrcan-rncan.gc.ca/eng/clean_fossils_fuels/carbon_capture_storage/zero_emission_combustion/gas_turbine_tech.html
where I propose replacing natural gas with biomethane to the extent economically possible.
David B. Benson,
You missed my point. You need to say exactly how much installed capacity of each generation technology you would install, how much energy storage, is the energy storage at site or centralised, and how much transmission capacity from each site. You have to demonstrate exactly which technologies are providing the power at each worst case instant in time.
Then put $ on it.
If we don’t do that we can all dream for ever about what might be possible at some time in the future. It is a totally pointless exercise.
Peter Lang #72,
Over the week-end I did some calculations for a National Grid in 2030, essentially X2 your figures with perhaps a peak about 70GW(6h 1-7pm) with off-peak 40GW.
A scenario of 115GW wind capacity at 35% capacity factor= 40GW, 240GWh per day solar(summer) and 120GWh/day(winter).
If solar has 3h storage will have up to 20GW peak either in summer( over 15 h) or in winter ( over 6h).
Pumped hdyro storage of 15GW( 20h average-300GWh), existing hydro of 5GW(1200 GWh/month) would be adequate for 25 days per month.
The issue would be the few days each month with widespread cloud cover and low wind conditions. Solar located in Northern Australia is going to be faily reliable but sothern locations less , so assuming a 50/50 distribution will have 60GW/day solar on cloudy days and 12h of wind at 10% capacity(11GW) and 12 h at 20% capacity(22GW) for a daily average of 760GWh for a total of 760+ 120(hydro) +300(pumped hydro) + 60(solar)=1240GWh.
If low wind was to persist for 24hours(perhaps once a month) would need another 260GWh that could be supplied by 11GW of OCGT capacity or an extreme case of 36h very low wind and high cloud would need 720GWh additional OCGT having exhausted pumped hydro storage( again about 11GW of OCGT).
If ten of these extreme events occur in a year would still be using less than 16,000GWh of OCGT, or 4% of electricty production.
This would require building 5GW wind capacity per year until 2030(4% of world building).
Compare this to completing 10 nuclear reactors (1.2GW per year from 2020) about 20% of present world nuclear building, and a faster rate than Japan( the second largest world economy).
By 2030 the nuclear option woukld still require 75% of power from CCGT or coal fired and would take until 2060 to have similar CO2 emissions as renewable options(4%).
The favoured option would be to build both wind( a little less) , solar and nuclear at least until 2030, then consider options based on costs.
Neil,
It is really great to have some numbers to discuss. Congratrulations. I hope others will follow your ecxample.
I intend to look at your calculations, but I am not sure how long it will take me until I get back to you.
In the meantime, before we can start looking at the calculations, we need to check the assumptions.
Point 1, if wind needs gas back up it saves very little GHG emissions, and at very high cost of emissions avoided (refer to the “Cost and Quantity of Greenhouse Gas Emissions Avoided by Wind Generation”). So installing wind power with gas back-up does not achieve the aim of reducing GHG emissions and it wastes our wealth – wealth that we will need to spend on solutions that really do cut emissions.
Point 2, if energy storage is centralised (as with pumped hydro and CAES) rather than at the generator, then the transmission system has to be sized to carry the full capacity of each generator to the storage. The cost of transmission can be expected to be some four times higher for centralised than for at-generator storage.
Point 3, hydro pumped storage needs constant power. I know you have suggested in previous posts that that there are other pumping technologies that mean this is not true any more, but I am not persuaded. Stand under the pipes at Tumut 3 (5.6m diameter by 1 km long and lifting 155m) and imagine that mass of water starting and stopping each time the wind blows. (I’m knowingly exaggerating to make the point for all readers that we need constant power for pumped storage hydro).
Point 5, average capacity factor you used for wind (35%) is too high. 25% would be very generous, probably too high.
Point 6, I have a problem with the date you selected as the basis of your comparison, 2030, because it is in the middle of the transition period where we are changing from current to near zero GHG emission levels. If we take a date in the middle of the transition period then obviously it favours the technology that has a 20 year start (ie wind). So it is not a sensible date to pick for the comparison. The date, 2030, has a built in bias against nuclear. If we use that date as the basis for our decision, we would make a bad decision – a decision that would not be the best way to achieve zero emissions.
Point 7, I don’t agree with your assumptions which are based on averages. We must design for the worst case, not for the average conditions. The worst case is: no significant wind for 5 days, cloudy conditions across the solar power stations, clouds moving. That is what we need to design for. If you look at the forecasts for the next few days you will see low wind conditions for several days. Watch the southern coast and south east NSW as it lookps theough the 2 to 7 day wind forecasts.
http://www.bom.gov.au/jsp/watl/wind/index.jsp
Then look at the chart of wind output versus time on the “Wind and carbon emissions – Peter Lang responds” thread. This si the sort of output we can expect from the wind generators during this time. Imagine trying to pump Tumnut 3 water with that sort of power variability.
Peter B
it’s funny how the Nullarbor Plain keeps getting mentioned. Neil H proposes a 1500 km HVDC cable to link to cheap West Australia gas generation and I think a Gen III with desal should be on the coastline to power the Olympic Dam expansion. The Brits detonated several A-bombs there in the 1950s. A nuclear power plant could supply the H2 to combine with bio C and also smelt steel in the area.
A flat sunny area with cold seas and sea breezes and maybe hot basement rocks could become an energy hub if the economics are right.
Neil (#82)
This has me confused. You say :
QUOTE
A scenario of 115GW wind capacity at 35% capacity factor= 40GW, 240GWh per day solar(summer) and 120GWh/day(winter). If solar has 3h storage will have up to 20GW peak either in summer( over 15 h) or in winter ( over 6h).
Pumped hdyro storage of 15GW( 20h average-300GWh), existing hydro of 5GW(1200 GWh/month).
If low wind was to persist for 24hours(perhaps once a month) would need another 260GWh that could be supplied by 11GW of OCGT capacity or an extreme case of 36h very low wind and high cloud would need 720GWh additional OCGT having exhausted pumped hydro storage( again about 11GW of OCGT).
UNQUOTE
I understand you have (in GW capacity): wind 115, solar 40, pumped hydro 15, existing hydro 5, OCGT 11.
So when the wind isn’t blowing and the sun isn’t shining you have 31GW generating capacity to meet a peak demand of 70GW. That is less than halfe the generating capacity we need to meet the demand.
Am I missing something?
Peter Lang (81) — I believe you missed all my ponts. I’ll try again.
1. Wind is suitable for loads which are interruptable. An example is generating and storing pure oxygen.
2. In of itself, biomethane powered gas turbines are almost carbon neutral. I claim biomethane is competative with natural gas (most of the time).
3. You should know that burning gas creates heat for only around 60% of the CO2 for the same amount of heat from burning coal.
4. Oxy-fuel with carbon capture is almost carbon neutral using fossil fuels and is carbon negative using biomethane.
Points I didn’t make clearly enough, it seems:
5. It is economic to use wind instead of burning gas when the wind blows. It is economic to provide gas turbine backup for some amount of wind. This is in fact being done here in the Pacific Northwest. (I just read an older piece by William Hoagland which states “if wind power constitues more than 25 to 45 percent of total power supply, any shortfall [of wind blowing] causes severe economic penalities.”)
Now I cannot design a power system for the eastern Australia grid, as there are too many factors I do not know. However, I did suggest a sensible growth plan without gving precise figures. I’ll go a step further: install enough wind turbines to generate enough oxygen so that all existing gas and coal fired units are oxy-fuel with carbon dioxide capture.
I am sure that the Aussie power companies will quickly realize the benifits of incorporating increasing amounts of wqind and turning off the gas fired units when the wind blows.
David B Benson (#86)
You say the system you propose is economic. But you provide no cost figures to substantiate your assertion. There are litterally thousands of uncosted proposals being put up all the time. One suggestion was to put solar panels in space so they could be in the sun all the time and then beam the energy back to receivers on Earth. Can you tell me how we can beam 25 GW of power from space to Earth?
Without sensible costs of proposals, with unit cost rates that can be substantiated from competitive bids, I do not want to get involved in what I would consider time wasting efforts.
The cost needs to be a system cost to provide the power quality we require. Keep it simple and provide the following:
25GW average power
33GW peak power in mid winter at 6:30pm
20GW baseload
600GWh energy per day
450GWh energy between 3pm and 9am
Wind power distributed along 4000 km of Australia south coast and transmitted to east coast
Limited pumped-hydro or CAES potential available (2.2GW currently installed). 10 to 15 GW may be achievcable at considerable cost.
Please read the “Cost and Quantity of Greenhouse Emissions Avoided by Wind Generation” so I do not need to explain the points made in it. Also please read “Solar Power Realities” as that covers some of the key cost and environmental issues with energy storage.
Peter Lang (87) — I don’t have the exact cost figures, just the experiences of local power companies who a few years ago augmented our considerable hydro resources with gas turbines and are now going full bore adding wind turbines. Since these power producing companies have to attract capital, they’ve already justified what they are doing to their boards and investors.
I could make up an example which demonstrates why it is good microeconomics to use wind with backup gas, but I fear you would then complain it was just made up.
As for oxy-fuel, there are plenty of web resources to read up on it. I can’t locate particular articles just now, but you’ll find that the elevated operating temperatures so produced generater enough extra power to pay for CCS and even oxygen generation. So as I said, first convert all of your existing gas and coal fired units to oxy-fuel with CCS. You’ll quickly find that adding wind power for interruptable uses makes good sense as well.
Anyway, here is another way to solve the climate crisis.
Irrigated afforestation of the Sahara and Australian
Outback to end global warming
http://www.springerlink.com/content/55436u2122u77525/
(Note the pdf is free to view). If Aussies want to do this, there will be the need to RO and pump a lot of water. But again, this can be done on an interrupted basis, so using low cost wind is most economic.
Peter#85,
What you are missing is that even in low wind conditions some wind is available, just look at figures for 13 wind farms in a 1300km spread usually have more than 5% capacity. We should have 10% of capacity as the minimum.
The other issue is that solar is always at peak demand( within 3h storge limit) so even if only 50% of solar is available(60GWh of winter 120GWh) this can still supply a good portion of peak(10-20GW). So 11.5GW wind, 15GW pumped 5GW non-pumped hydro, 15GW solar =46.5GW; I made a mistake ( working from memory) would need 24GW OCGT not 10GW but only for a few days per month(ie <0.1 capacity factor) so less than 4% of total average demand( 50GW).
I would think that a significant amount of solar located in northern Australia is going to give more than 25% of summer out-put(GWh) in winter, but only a guess. 3h storage allows flexibilty if high wind conditions are present( ie not overloading storage).
Neil Howes (89) — Using OCGT only a few days per month may not be the most economic solution. Depending upon capital costs, more like 17% of the time perhaps.
Still in all, well done!
Neil (#89),
You say: “look at figures for 13 wind farms in a 1300km spread usually have more than 5% capacity.”
‘Usually’ isn’t good enough. What do we do on the other ocassions. The ocassions where there is no wind and no sun?
3 hours storage at solar thermal plants wont get us very far. Especially when it was drained last night and there is no sun today over a large area of the solar belt.
How do we get 70 GW power when the wind is not blowing and the sun is not shining. There are ocassions when there is no wind and no sun. How do you provide the power when that is the case? Your total is 31GW to cover 70GW. It doesn’t work.
We need to have a system that CAN meet peak demand, ALWAYS. If you want to propose wind power then you must include storage to enable it to provide the required power output at all times.
We’ve also moved the goal posts to 2030. That is fine but it requires a whole lot of new analyses for that demand. And I do not have all the figures at my finger tips. So can we please stick with the comparison we started with – that is to meet the demand experienced by the NEM in 2007, and specifically July 2007 because July had the highest energy demand, highest peak power and highest baseload. We have current costs for all the technologies and we have the CO2 emissions. We also have the goal of no fossil fuels to be used. Let’s stick with that scenario as the basis of the comparison. Otherwise there are too many ifs, buts and maybees.
Neil,
We cant conduct any sensible discussion if we adopt a wishfull thinking approach. There are times when there is negligible wind and negligible sun, and these can last for days. We have to be able to provide power throughout and provide the expected level of power quality. If we are going to use intermittent renewables then we must include energy storage. Whether the energy storage is mostly at the generator or mostly centralised is a trade off between transmission costs, storage costs and cost of controlling power quality.
“According to a commenter on The Oil Drum lead acid storage is over 10 c per kwh or $.1 per 10^3 wh. […] Thus battery storage of 450 Gwh could be around 450 X 10^6 X $0.10 = $45 million. Tell me if I’ve lost some zeroes.”
A 1 kWh capacity deep-cycle lead-acid battery would weigh ~30 kg; where can I pick up one of those behemoths for 10 cents?
You’re confusing the cost of capacity(the cost of a battery with a given capacity) with the levelized cost. The levelized cost is the price you pay for each kWh you store and retrieve; if you want to store and retrieve 450 GWh per day you’re going to pay ~$45 million per day. It’s actually a little bit worse than that since the round-trip efficiency is not 100%.
I don’t know what’s included in that levelized cost but I have come to expect dishonesty from TOD commenters; I would not pressume that operating costs are included(someone has to manage when the batteries charge and discharge, someone has to guard the facillity, someone has to deal with government bureaucracy etc.), the cost of borrowing(such a large project is not going to be funded out of pocket; utilities will borrow money to do it and that can easily double total costs versus overnight), the cost of land, the cost of inverters and transformers. There are also various circumspect costs; there just isn’t 450 GWh of batteries to buy, if you don’t slowly ramp up demand, supply is not going to keep up and you’re going to pay a huge premium for what batteries you are able to buy.
Peter#92,
We can only estimate the performance of a large collection of wind farms over a wide area by either modeling based on wind data, or looking at the limited NEMMCO wind farm outputs ( presently 12 operating farms with Capital being commissioned( I think about half of the 140MW in operation).
The two issues are;
1) expected maximum output( % capacity)98% of the time ( accepting that a small amount of load shedding would be tolerated; say 10% for 2% of the time ie 0.6% of output).
2) expected minimum output and for how long, ie 5% of capacity for 1h once/month?, 10% capacity for 10hours/ 3 times a month?.
The 11 wind farms data for June,2009 gives a hint of what to expect. Comparing any 3 locations with any 6 locations and then comparing this to the 11 locations it is evident that a the number of locations increase the max output decreases and the min output increases.
Any 3 wind farms with good separation range from 0 to 94% capacity, however, 11 wind farms over a 1300km separation “usually” produce at least 5% of capacity and less than 80% capacity. This gives us an indication that 50 o wind farms over a 3,000km separation are going to have a higher minimum and a lower maximum output and be outside these values a lot less than 11 wind farms.
The data of the present 13 farms shows that close sites are highly correlated and distant sites less correlated, and each location has a very high variance in output. More sites are going to lower total variance, just as two nuclear reactors may have a loss of 50% of power, 100 reactors are likely to reliably produce 80-95% of total capacity. We don’t expect any power system to be 100% reliable, none are, but we do expect >99.9% reliability and use load shedding the other 0.1% of the time.
If we are trying to model a future electricity supply system it’s not dreaming to think we will have a truly national grid
or to envision power demand in 2020 or 2030. That’s how long it will take to replace coal-fired by any other energy resource.
Some of your other comments about average capacity seem to be wrong.
Infigen(IFN) is the largest wind developer in Australia with over 500MW operating and 1000MW in planning or construction. They report 0.35-0.36 capacity factor for Australia and a similar value for US(>1000MW capacity). Their European farms are only 0.24 capacity. Australia has some very good wind locations along >4,000 km of coastline and mountain ranges, so I think 0.35 capacity factor is a good value to use.
It should be possible to look at solar data over Australia to get an idea of the lowest winter output from solar farms located in northern Australia. The no sunshine at night is not an issue if solar is being used to boost daytime peak supply. I would assume no carryover storage day to day, just 3h storage to reduce maximum output to generator capacity and extend power to 6-7pm.
Peter#87,
An interesting point about a grid from Cooktown to Geralton along the coast it that not a lot of the power has to move very long distances. Most is going to be produced and consumed within a few hundred km just as it is now.
We don’t have to move 33GW from one end to the other, just some of the minimum expected output, say if the lowest wind power was 5GW out of the 33GW, and a third of this came from WA, some would be used locally, so perhaps only 2-3GW would be moved to SA, 1-2GW on to VIC and 0.5-1GW to NSW.
The largest pumped hydro storage is located smack between 65% of the nations power consumption in NSW and VIC, so this is where large amounts of power have to be moved quickly.
To incorporate significant amounts of solar power generated in northern Australia transportation is more of an issue, as it would be required during peak(about 10GW out of 33 peak). If 40% was to go to Brisbane(1500km) and another 40% to Adelaide(1500km)then the existing distribution could feed the small surplus to Sydney and Melbourne, with the expanded Snowy and Tas Hydro providing the bulk of the NSW and VIC peak.
Peter#83,
Some of the other points you raised
“Point 1, if wind needs gas back up it saves very little GHG emissions, and at very high cost of emissions avoided”
Back-up OCGT only creates CO2 when operating. In US some OCGT operate at 0.10 capacity, this is what’s proposed here, about one third peak demand being OCGT at 0.10= 3.3% of power(4% of CO2 emissions compared with 100% CCGT)
“Point 3, hydro pumped storage needs constant power.”
I was suggesting that pumped storage always is supplied from grid power(which is constant). Pump rates can vary and different numbers of turbines can be pumping.
“Point 6, I have a problem with the date you selected as the basis of your comparison, 2030, because it is in the middle of the transition period where we are changing from current to near zero GHG emission levels.”
Take a date when all power could be generated by nuclear(2050-60?). The issue is the TOTAL CO2 emitted between now and that date, not what’s emitted in 2060. A good reason to go to OCGT and CCGT while waiting for low CO2 technology. One GW of wind now is going to save a lot of CO2 before the first nuclear plant is completed. If we build another 0.5GW of OCGT back-up, it displaces 0.5GW coal,(ie we use 0.35GW av wind and 0.15GW av OCGT=0.5GW firm power)
“If you look at the forecasts for the next few days you will see low wind conditions for several days. Watch the southern coast and south east NSW as it lookps theough the 2 to 7 day wind forecasts.”
When I looked at the wind forecast from 9th to 15th Sept, can see a low wind region moving easterly over SA and on to NSW, but both TAS and SW of WA have >30km/h winds. These low wind “cells” seem to be about 1000km in diameter, ie cover about 10% of the continent or 15% of the coastline where wind farms would be sited.
Will be only pumping at Tumut3 during high wind events, and definitely using grid stabilized power not variable power.
Neil,
Thank you your posts #92 to #94. I’ll have to get back to you on this as I am working on other things at the moment.
Just so I don’t leave other readers wondering, I have to say that a lot of what you are saying sound like it comes straight from the wind industry. Much of this is false spin. The optimistic modelling results that have been promoted fro decades are proving to be false. That is the experience in EU, US and recently Australia is showing the same.
You can find, and probably already know about the actual statistics. I am not interested in debating all the theoretical stuff promoted by the wind industry. We have to be able to supply the power to meet demand at all times. Wind, without storage cannot do that and not can solar. So let’s not waste time trying to make up schemes that depend of 5% or 10% of wind power at all times. Because there are times when we cannot have that power. I don’t have the interest in trying to debate that argument with the wind industry advocates.
Here is an interesting wind power backup scheme.
A Power Station in Your Basement
http://www.spiegel.de/ international/ business/ 0,1518,647435,00.html
Peter#97,
I have looked at both the wind data from NEM and the data you have provided and don’t see any 5 day period where wind is less than 95MW average(>10% capacity and your data showed the lowest 5 day period for solar was 60kW/day( 33% average of 180kWh/day).
Does this seem like the minimum power available for a 5 day period?
Neil, (#99),
Why do you keep talking about averages? It is the minimum power at a point in time that is the key. For the scenario we are considering, we need 25GW at all times. Keep it simple as a first step and find the minimum output. Wind gereration goes to zero at some times on all existing networks. So zero power is all you can depend on from wind power. I nderstand “capacity credit” but that applies with fossil fuel back up. That is not what we are talking about in this scenario.
We need every tool we can get. I for one am a huge propoent of biochar. I’d sugest anyone interested visit http://www.outbackbiochar.com for biochar information, biochar research and the latest biochar news. This wonderfully informative site has gardening tips with biochar, recent studies published all over the world and informative biochar articles. In addition you can purchase biochar for your home garden from Outback Biochar. Thank you in advance for your support and remember, if we all work together we can make real progress on climate change!
Barry,
I have just seen this on the Whyalla Solar Termal power station (your photo and bio on the last slide):
http://www.epnrm.sa.gov.au/LinkClick.aspx?fileticket=LWB541dthKI=&tabid=2732
Combining this and other sources gives costs and power and capital cost as follows:
Demonstration phase, 4 dishes, total 0.5 MW, cost $16 million = $32/W
Total project, 600 dishes, total 80 MW, cost $350 million = $4.4/W
The references also say the plant will have sufficient storage to enable it to provide baseload and peak power.
Do you know what is the average power it can provide, 24 hours a day? Can you give me a link to an authoritative reference?
Peter #34967
I can’t recall, they didn’t give any useful details, but I think I recall it was 7 hrs — it’s based on the Wizard Power big dish, so Ted Trainer’s references above to it are relevant.
In case you’re confused, that Whyalla CSP presentation was given by Eddie Hughes — I’d given a separate presentation before him (which was not on CSP). I don’t know why my photo/bio ended up at the end of this slidecast.
[…] Trainer, T., (2010), The potential and the limits of solar thermal energy, http://bravenewclimate.com/2009/08/31/solar-thermal-questions/ […]
[…] of solar thermal power plants has been, well… an absence of data. Trainer noted, in ‘Solar Thermal Questions‘: It would be great to get some actual data on their year round performance. I have found it […]