


.png)
 How can we compare the cost, performance and value-for-money of alternative large-scale clean energy projects? Actually, it’s pretty tough to try and avoid apples-and-oranges comparisons. Still, some adjustments can be made, such as for capacity factor, to partially levelise comparisons.
Below is a simplified comparison of four recent real-world projects. All can be considered first-of-a-kind installations, except for the wind farm.
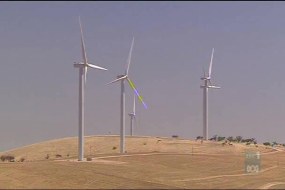
1. A large proposed wind farm in South Australia (600 MWe peak)
The wind project will use 180 of the 3.4 MWe Suzlon turbines and “generate enough electricity to power 225,000 homes“. It includes a biomass plant that could produce up to 120 MWe of backup power to cover low-wind periods, and might offset up to 2.5 million tonnes of CO2 per year. At average 8m/s winds the capacity factor is estimated to be about 35%. A 60 km undersea high voltage direct current cable will connect it with Adelaide. Cost is $1.3 billion for the generating infrastructure and $0.2 billion for the cable.
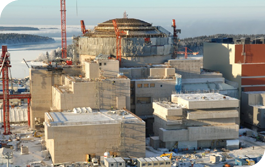 2. A large Generation III+ nuclear power plant in Finland (1600 MWe peak)
The in(famous) Olkiluoto 3 NP unit, a European Pressurised Reactor (EPR) being built by the French (AREVA). The project has seen significant delays (first electricity now expected in 2014), and a cost blowout from the original € 3.7 billion to a new figure of € 6.4 billion. Despite this, the Fins have ordered two more EPR units. Assume it runs at the average Finnish capacity factor of 86%.
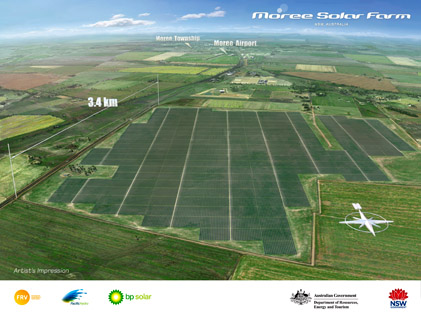 3. A large solar PV plant under construction in New South Wales (150 MWe peak)
To be built in Moree, this will cover 3.4 km squared with 645,000 multi-crystalline PV panels, and is forecast to output 404 GWh per year (enough for 45,000 households). Part of the “Solar Flagships” programme, the cost is $A 923 million. Estimated to abate 364,000 tonnes of CO2 per year (based on NSW emission factor 0f 0.9 tCO2/MWh). Estimated capacity factor is 30.7% (based on peak power and GWh forecasts) — this seems high compared to typical PV performance.
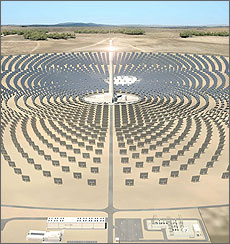 4. A state-of-the-art solar concentrating power plant with some energy storage, in Spain (20 MWe peak)
The Gemasolar CSP plant in Andalucía started electricity production in late 2010. There is a detailed summary of projected performance here. Peak output is 19.9 MWe, anticipated output of 110,000 MWh/yr from a mirror field covering 190 ha. Cost of € 230 million (much higher estimate of £ 260 million here). It is a Power Tower facility with 2,650 heliostat units (120 m2 each) and 15 hours of thermal storage (not sure of total amount of thermal energy stored – I presume enough for peak turbine output, which would be just under 300 MWh of final electrical energy). The capacity factor as a result of the thermal storage is anticipated to be 63.1% (the site has 270 productive days per year thanks to the excellent desert siting).
——————-
Okay, let’s try a few ways of squaring these options off — and then explore details and alternative assumptions/calculations in the comments. (I know some have already been reported by various commenters in the BNC Open Threads, but this is a good place to centralise and reiterate/update them.)
First, let’s consider the capital cost after standardisation for capacity factor, and bringing output up/down to an equal power rating of a large commercial facility (1 GWe electric average, the size of a big coal-fired power station or the average output of the AP1000 reactor) and then equalise this to $USD. Average exchange rates for 2011 are 1 USD = 0.73 Euro = 1.03 AUD = 0.63 UKPS.
Wind (biomass backup): $US 6.9 billion/GWe
Gen III+ Nuclear: $US 6.0 billion/GWe
Solar PV (no storage/backup): $US 19.6 billion/GWe
Solar CSP (thermal storage): $US 25.1 billion/GWe (or $32.9 billion if the higher cost estimate is correct)
The rank is nuclear, wind, PV, CSP. The first two are one third the cost of the solar options, but the wind has only 20% of its peak output backed by the biomass.
What about the levelised cost of electricity (LCOE)? Such calculation involves many assumptions. Here is just one set, entered into the handy NREL calculator. All discounts set to 8.5%. The nuclear plant has an estimated operational lifespan of 60 years, whereas we can generously assume a 25 year lifespan for the three renewable installations (Q: does anyone know wind/solar farms that have run for longer?). For financing purposes, however, I will set the nuclear option to be a 30-year term, after which the LCOE is lowered for the remaining 30 years of operation.
Wind [ignoring biomass fuel] (Cap $2,427; Fixed O&M 50; Var O&M 0.002; Heat Rate 0; Fuel 0), LCOE = 10.0 c/kWh for 25 years, then infrastructure replaced
Nuclear (Cap $5,137; Fixed O&M 150; Var O&M 0.005; Heat Rate 10,000; Fuel 1), LCOE = 9.9 c/kWh for 30 years, then 3.6 c/kWh for the next 30 years (average = 6.75 c/kWh)
Solar PV (Cap $6,032; rest same as wind), LCOE = 24.4 c/kWh for 25 years, then infrastructure replaced
Solar CSP (Cap $16,833; rest same as wind), LCOE = 29.6 c/kWh for 25 years, then infrastructure replaced
It is clear again which option is most cost effective (especially given the baseload output and load-following capacity of the EPR reactor), based on current or recently proposed costs and performance figures. If people argue strongly below for me to modify any of the LCOE assumptions, I’ll consider it and may edit the above accordingly — I don’t claim these are final or definitive.
Filed under: Nuclear, Renewables, TCASE


Minor correction. No decision has yet been made as to who will deliver the new units in Finland. It could be Areva with EPR, but it could be someone else as well (Toshiba or Koreans, for example). In fact with all that has happened with the failed project management with Olkiluoto 3, I wouldn’t be too suprised if its going to be someone else.
Barry,
Thanks for the interesting and quick article on this. I have a few initial comments.
Is this a real cost increase (i.e. is that a cost increase compared with constant €)? Or is part of the increase due to inflation?
Does this mean that the wind/biomass options is not a fair comparison with the other options, in that it does not have the same availablity?
Shouldn’t options be compared on the basis that they all have the same availablity?
I believe the LCOE figures may be under-estimated. I suspect AUFDC and owners costs are not included in the Total Capital Required. See my comments here http://bravenewclimate.com/2011/10/15/open-thread-19/#comment-139008 and here http://bravenewclimate.com/2011/10/15/open-thread-19/#comment-139077 . Bothe the ACIL-Tasman (2009) and the EPRI (2010) report for the Australian government show the LCOE is much higher than calculated by inputing the Overnight Capital Cost into the NREL Calculator.
If we include the biomass the capital cost will be higher and the fuel and O&M will be higher. Furthermore, if only 20% of the peak capacity is backed up, then we need five times as much capacity to be comparable with nuclear. The wind turbines do not last 25 years. Therefore, the true cost of wind is much higher than the LCOE presented here would suggest. The emissions involved in the growing, gathering and processing the biomass fuel also need to be included.
Unless the plants have equivalent availability I’s argue these are not apples to apples comparisons.
The Huxley Hill wind farm (King Island) provides a good real-world example of the strengths and limitations of a wind installation. The wind has permitted the reduction of around 35% of the diesel use (but has virtually zero capacity credit) – there are suggestions that there may be efforts to further decrease the diesel use.
King Island represent perhaps the perfect location for a wind farm, as it is one of the windiest places on the planet, is isolated relying on diesel, uses a Vanadium Redox battery for wind smoothing (not working apparently?) and a variable resistor to permit high peak wind penetration with electronic spilling rather than requiring throttling of the turbines. Given the high residential load, the demand profile is probably peakier than the mainland, presumably decreasing the performance of the diesel generation. The close proximity of the wind farm to the Currie Power Station diesel generation avoids the difficult grid-connection and loading issues normally encountered in a grid.
The cost of energy in 2008 was 56 cents/kWh. Hydro Tasmania subsidises 57% of the cost of energy to King Island residents.
If King Island’s near limit is a 35% fuel reduction (with no diesel capacity displacement), what would a realistic limit be for a national grid, at what cost, and what would it take to displace base-load generation capacity?
http://www.gpoc.tas.gov.au/domino/gpoc.nsf/LookupFiles/Bass_Strait_Islands_Electricity_Price_%20Inquiry_Draft%20Report_June2008_080619%20PDF%20version.PDF/$file/Bass_Strait_Islands_Electricity_Price_%20Inquiry_Draft%20Report_June2008_080619%20PDF%20version.PDF
http://esvc000085.wic012u.server-web.com/tas/King%20Island%20%20-%20Towards%20a%20sustainable%20energy%20future%20-%20Ryan%20Willems%20-%20Hydro%20Tasmania.pdf
Barry,
I’d suggest the technologies should also be compared on the basis of $/tonne CO2 avoided. If the EPRI report to the Australian government of the LCOE of the various options is correct, it would seem that gas with or without wind, is a lower cost option than nuclear for reducing emisisons. We seem to keep avoiding the reality (unless someone can show that EPRI is wrong). http://www.ret.gov.au/energy/Documents/AEGTC%202010.pdf
The EPRI 2010 report gives these LCOE (in constant 2009 AUD) for new entrant technologies into the Australian National Electricity Market:
coal (w/o CCS) = $78/MWh
CCGT (w/o CCS) = $97/MWh
wind (36.6% CF and no back up) = $147/MWh
nuclear = $173/MWh
solar thermal (6 h storage, CF = 31.6%) = $330/MWh
About $15/MWh should be added to wind and solar for transmission and grid enhancements.
People always talk about how many homes can be powered from this wonderful new energy project X.
In my country, the Netherlands, homes use only 21% of the electricity. Most is used by industry, commercial sector, and services.
So saying it will power x homes is useful for familiarizing the issue, but is also a factor of almost 5 underestimating them problem.
Two EPRs would power all homes in my country. But we’d need 8 more to power the country.
If I used the previously linked NREL cost calculator and using the 4 euros per Watt cost estimate, I get about 7-8 eurocents per kWh. Seems perfectly affordable (even for a first of a kind such as Olkiluoto)
It is by the way not useful to look only at kWhs or average kW for wind and solar since these sources are unreliable and intermittent. So you can not power the country simply by dividing the kWhs of a total country by the kWhs of a single wind turbine or solar system. You end up with lots of electricity when you don’t need it and have to dump most electricity.
Natural gas is all well and good for reducing CO2, but when you take into account methane emissions from drilling operations, it’s not such a pretty picture. There’s dispute over exactly how bad it is, but that’s because the industry has resisted adding the monitoring that would nail it down.
Of course, using a nuclear reactor for load-following would bring down its capacity factor, but increase the value of the delivered electricity in a way that is hard to account for under this scheme. I’m not sure how that value can be captured and set against other schemes, but the Gemasolar CSP plant should presumably qualify for some of that credit if it is being used that way.
Part of the problem pro nuclear advocates have in getting the point of this post across, i.e. that nuclear power is the cheapest most highly scalable low carbon electricity option available now, was illustrated in a debate hosted by Science Friday on NPR (US National Public Radio) March 15, 2010. Audio and transcript available here: http://www.wbur.org/npr/124361799/can-technology-solve-nuclears-problems
The pro nuclear people in the debate actually allowed the anti nuke to get away with his claim that because the cost of the Oikiluoto 3 Areva EPR had escalated to around $7 billion US dollars the project had turned out to be a “tombstone” for the nuclear industry instead of its “poster child”.
The anti nuke was Lester Brown, who is presently the President of the Earth Policy Insitute in Washington. There were three pro nuclear types, Richard Lester (head of Dept of Nuclear Science MIT), Griz Deal (CEO Hyperion Power), and Scott Burnell (PR officer, US Nuclear Regulatory Commission). The only one who addressed Lester Brown’s assertion that $7 billion for the Finnish reactor was such a high cost it might end all interest in building nuclear reactors everywhere, was MIT’s Dr Richard Lester.
MIT’s Dr. Richard Lester said this: “Yes. Well, let me just say that Lester Brown is right about the cost issue. The – unless we can bring down the costs, unless we reduce the financial risks, and unless we can reduce the cycle times for designing and building nuclear reactors, it’s going to be quite unlikely that we’re going to have our companies – private companies willing to go forward with these things.”
In the US it is standard practice for renewables advocates to crank out any sort of lie that implies nuclear power is too expensive for anyone to seriously contemplate using. But nuclear advocates might as well shoot their industry in the head if their response is as lame as Dr. Richard Lester’s was in this example from NPR.
I compared the cost of electricity generated by Nevada Solar One, a large US solar thermal project, and electricity generated by the Finnish Oikiluoto 3 plant in this way: NREL data indicated that the $266 million USD Solar One would produce 134,000 MW per year, or $17,385 per available kW. Using anti-nuke Lester Brown’s data for Oikiluoto 3, i.e. $7.1 billion for the 1.6 GW plant, I assumed 90% availability and came up with $5,000 per available kW. I summed up the difference by saying a government could give nukes away for free after paying their entire cost and get cheaper power than encouraging things like Nevada Solar One with subsidies, because the government subsidy for Solar One was said to be in the 1/3 range, i.e. $5795 subsidy per available kW.
The subsidy for the solar plant exceeded the entire cost per available kW of the supposedly too expensive to ever be built again first of a kind nuclear plant in Finland.
James Hansen said this, when in New Zealand recently, on 4th generation nuclear power
“it’s really a case of you should be examining that, along with all the other alternatives, because we have an emergency situation”.
Hmm… wind looks pretty competitive. Especially if we add a price or some other measure for “social acceptance” to the picture.
@Joffan ; Exactly, EDF in France is only at a 80% capacity factor, but they are doing load-following, and it’s the fact they do load-following that allows nuclear to represent such a high part of electricity generation without problems.
Actually the EDF case shows that load-following works a lot better with nuclear than is usually said, the silly thing is that it apparently heightens the costs as it lowers the capacity factor so operators will try hard not to do any of it, but it’s a completely essential factor to a power source that’s really able to provide most of the load. Comparatively wind & solar are horrible, and the cost of the enery storage/backup they require is the straw that makes them a non-solution, even if their costs lowers a lost as pro-solars keep saying almost everyday.
The wind price ignores biofuel consumption. I wonder how much that would affect it.
Personally I’m not a fan of biofuels, given their enormous land use and, generally speaking, high net carbon emissions once you take things like deforestation into account.
But if you skip the biofuels and use wind just for non-baseload power, it’s pretty decent. If we go with fast reactors and we’re constrained by startup fuel for a while, wind could definitely round out the picture.
Affordable and scalable energy storage would also help. Here’s an technology being touted as unusually affordable, as well as scalable:
http://gigaom.com/cleantech/aquion-energys-cheap-edible-grid-battery/
Do The Math looks at storage and argues that we need a full seven days’ worth of storage to rely on renewables:
http://physics.ucsd.edu/do-the-math/2011/08/nation-sized-battery/
The wind plant is about 200MW average, for $1.5 billion. Let’s say we really need only 2 days storage, call it 50 hours. The article says that 500 megawatt-hours of storage goes for $80 million, so if we need 50 hours, that $80 million handles 10MW. For 200MW we’re talking $80*20=$1.6 billion, approximately doubling the cost.
I agree with Peter Lang that a useful metric is cost of CO2 avoided. If each of the technologies has zero fossil CO2 including biomass burning perhaps this could be measured as
(LCOE – benchmark cost) / benchmark CO2
with the benchmark being a carbon taxed combination of open and closed cycle gas costing say $100 per Mwh (10c per kwh) and with O.55t CO2 per Mwh.
Converting the quoted figures to Mwh and rounding this gives
wind (100 – 100)/ .55 = $0 per tCO2 avoided
nuclear (99 – 100)/.55 = -$2
PV (244 -100)/.55 = $262
CSP (296 – 100)/.55 = $356
For contrast for black coal the figure would be
(80 – 100) / (0.55 -1.0) = $44 per tCO2 avoided relative to gas. Coal is cheaper than gas but there is a negative CO2 saving. The negative figure for nuclear arises since it is also cheaper than the gas benchmark but with a positive CO2 saving. If this approach has merit it should still be used with caution; for example it may be valid for wind at about 10% penetration not several times that.
The value of this approach is to shoot down those who would spend hundreds of millions of dollars in public funds (like Moree) for a pathetic CO2 saving relative to cost. When Moree is built the PM of the day will make some grand speech about how the future of energy has arrived. Hopefully the public will respond by saying if that’s the future we’ll go broke before we ever get there.
[…] cost comparison The Brave New Climate blog has an interesting post up today about the cost of four different types of carbon-free […]
Barry — Experiment with the wind farms around here indicates that although the theoretical CF for the COlumbia Basin is 30% the wind farms are only able to manage a CF of ~26% despite perferential dispatching. I surmise that the wind farm operators are not able to keep all of their wind turbines in operable conditions at all times, hardly a surprise.
I don’t know how the Finns intend to operate their new Areva EPR (when complete), but if the goal is maximum capacity one surely expects better than the CF of 92% now obtained by Gen II NPPs in the USA and also better than the 93% obtained by Siemens NPP in England.
As for actual lifetimes as opposed to design life, I suggest 25 years for wind turbines [can only receive 15 year mortgages in the USA]. I also suggest ~40 years for solar PV, but of course nobdy knows. The design life of the Areva EPR is 60 years but based on Gen II experience one ought to be able to expect another 20 years beyond that. But possibly for this exercise your more conservative estimates of actual lifetime are appropriate.
John Newlands — That is a fine start. I suggest modifying the value for wind since typically wind is backed by CCGTs [here and in Texas]. So the CO2 avoided is only the actualized capacity factor; here it is ~26%.
A couple of comments and questions;
1. Most solar PV manufacturers, depending on technology, claim lifetime performance drop of up to 1% per year to ~85% at 25 years, which makes the simple approach Barry was looking for a bit more complex I guess.
2. If I’m the operator of an extremely modular plant, I can push past 25 years replacing bits that are failing (ie wind turbines, gearboxes, PV modules and field components in CSP). I’m not repurchasing ground work or foundations necessarily.
3. If I’m the operator of an Areva EPR NPP what costs are incurred after 30 years for replacement steam generators and turbines?
4. What is the refueling interval of an EPR – how long is it offline for at what separation of years and where does the backup come from?
5. If I’m the operator of a 10c/kWh baseload plant with an existing average baseload electricity price of 2.5-4c/kWh, who are my customers?
Zvyozdochka (@Zvyozdochka), on 22 October 2011 at 12:14 PM — Some answers:
(3) There are many fine makers of Rankine cycle steam turbines. Determine what the design life is claimed to be.
(4) Replensihment for the ATMEA1 is as little as 16 days each two years. The Areva EPR might take twice that long, but again each two years. These are scheduled outages and the grid operator decides what the alternative source(s) are to be.
(5) Then you had bettr not be a merchant owned operator. [Indeed, it is precisely this problem which keeps ERCOT (the Texas grid) for acquiring any NPPs.] If you are part of an old fashioned vertically integrated utility then the generation costs are the average of all generators operating.
following
The lifetime capacity factor (design target) for the EPR is 92%.
The lifetime capacity factor (design target) for PV installations in the desert is 20%. In Germany it is 10%.
Re cost of steam generators and steam turbines – lower than the solar inverter replacement cost. The actual inverter versus steam generators/turbines cost is not that much different in $/kWe capacity, but the PV plant has low capacity factor – that means the inverter capital investment is low return and thus high levelized cost…
It is interesting that people here imply to me that nuclear plants need to be offline for refuelling and that this is somehow a problem that PV plants don’t have so that in their minds less fossil fuel must be used for backup with the PV plant. When you realize PV is not there almost all of the time (not there on average 80 to 90% of the time). How can people make such implications?
It is also interesting, rather I should say suspect, that the figures referenced by Peter Lang require a 11,000kWe price to make their levelized cost figures match. The most expensive nuclear power plant being constructed today costs 4000 euros/kWe. What does this tell us about the EPRI reference? The EPRI is anti-nuclear or not thinking clearly.
Of course, when no nuclear plants are actually being constructed in Australia, its such an easy (I’d say cowardly) pick for blowing up cost estimates.
For some reference calcs to support my statements,
http://energyfromthorium.com/forum/viewtopic.php?f=39&t=2799
Your assumption of over $6000 capital cost per kW for solar PV looks somewhat high to me, since the latest reports from Germany say 2360 Euro on average even for small scale rooftop systems. Reference Stiftung Warentest as cited on my blog a couple of days ago:
http://k.lenz.name/LB/?p=4786
For big projects of over 20 MW the German government in May calculated with 2030 Euro per kW:
Erfahrungsbericht (Report on experiences), is.gd/PWS3N8 Page 129
The German government calculated LCOE for solar in May as about 20 cent Euro for a 20 MW project. That would be about the same general area as your figure of about 24 cent US. However, Australia has at least double the solar resources of Germany, so getting the same result actually is different by a factor of at least two. One reason might be that the German government assumes 4% financing costs, a reasonable value with a feed-in tariff guaranteeing long-term stable profits for all projects, which in turn reduces risks for banks.
As a consequence after the latest revision in summer of this year the feed-in tariff pays about 21 cent Euro for large-scale projects, which makes sense in Germany, but would be probably about double of appropriate LCOE in Australia.
Another interesting way to compare energy sources is to compare how much electricity they generate over their lifetimes. While interest rates vary, the total energy output of a Watt of capacity is indisputable.
http://energyfromthorium.com/forum/viewtopic.php?f=39&t=2619
There I calculated that our old crappy nuclear power plant has a lifetime energy generation of 393 kWh per Watt of installed electrical capacity. Compare it to an actual solar project here, that produces 18 kWh per Watt of installed electrical capacity.
The nuclear station produces 22x more electricity over its lifetime than the solar station. In Australia, with perhaps twice as good solar performance, it would still be 11x less than the output of the nuclear station.
Here’s a graph of that lifetime energy generation which one of my friends made (it is in Dutch but you can see what it’s about)
http://energyfromthorium.com/forum/download/file.php?id=972&mode=view
Karl. As we have discussed before, PV in Germany is a marginal energy source – it only saves a little on fuel. You still need the coal plants, the plant personell, the office personell, the maintenance contracts – which will be bigger if you throttle the plants more to take into account the solar grid. You still need all the materials to build the disgusting coal plants and maintain them, and the materials to make the PV systems are added to that.
Grid connected PV competes with fuel, and nothing else.
So if it costs 20 eurocents per kWh it will be competitive where fuel costs are higher than 20 eurocents per kWh. For example, in a remote location diesel-PV hybrid. Coal at 2 cents per kWh is rather a different animal.
Germany’s grid connected solar PV makes no sense at all. Not environmentally, not economically. Even if the cost would be halved. In fact, if PV costs nothing (!) you still need to burn fossil whenever it is cloudy, dark, winter, snowing, and raining. Which on average is 90% of the time in Germany. If PV costs nothing, Germany will still be locked into fossil fuels.
Cyril R., @ 22 October 2011 at 6:59 PM
I need something better than that to demonstrate that EPRI has a significant error in their calculations or assumptions.
Until you can point out where there is a significant error in the report, I am persuaded that the report is reasonable and realistic.
As the report explains there is a substantial difference between overnight cost (Total Project Cost) and the Total Capital Required (TCR). In fact TCR is almost twice TPC). It is the TCR that must be entered into the NREL LCOE calculator to determine LCOE. By the way, this was the case in the 2006 EPRI report for UMPNE report and the ACIL Tasman reports. So I am persuaded that the methodology is correct.
But that is the Overnight Cost, not the Total Capital Required. It is TCR that must be used for calculating the LCOE. Do you agree?
Firstly, I don’t know why you say EPRI is biased against nuclear. I understand EPRI is funded by industry and trusted by industry to provide industry with reliable information.
I am not convinced EPRI has inflated the costs of nuclear. In previous comments up thread we’ve found that the EPRI Overnight Cost for nuclear is similar to VC Summers 2 and 3. As far as I can tell, EPRI have used a construction period of 36 months for an AP1000 as the basis of their calculations. This will be a gross underestimate of the construction period for the first plants built in Australia.
For these reasons, I am not persuaded the EPRI report is overstating the cost of nuclear for Australia.
I hope you will read the EPRI report, especially sections 4, 5, 9 and 10 and see if you find any glaring errors.
K-F Lenz, there are no assumed prices in the above post – these are all reported costs for these specific projects, including the yet-to-be-constructed solar PV plant in Moree.
@Barry Brook
Sorry for the misunderstanding. Seems still rather high to me.
Peter Lang. 4 euros per Watt is the total Olkiluoto project cost. Overnight cost was initially 1875 euros per kW. The 4000 euros per kW includes all the cost overruns and cumulative IDC so far (and the project is almost finished). The 4 euros per Watt can be considered total project cost.
Perhaps there is confusion in the terminology here. Overnight cost means as if the plant can be built in one day (ie with no financing time). This is of course not possible. Total project cost is what the project cost taking into account the time to build the thing and the interest required to cover the construction period where the money has been paid but no plant is operating.
NREL’s calculator calculated an interest rate over the capital cost that you fill in. So if you enter total project cost you are doing double counting on the interest which gets you an artificially inflated levelized cost figure. To get levelised cost in a calculation like this you must use overnight cost. Otherwise you’re doing double counting on the interest rate.
It’s possible to take the cost overruns and deflate it to match it up to the overnight cost and then add that to the original overnight cost so that you can use that in a levelized cost calculator such as NREL’s. But then you must know the interest rate during construction to deflate the figure.
Besides that double counting trap, some of the total project cost includes lump sum figures that are actually part of the operating/running cost (for example the cost of the first core – which is actually operating cost not capital and is already included in the operating cost contract). Such costs aren’t part of any capital calculation with assorted interest rates… You just can’t lump in all project costs and pretend it is all overnight cost and then apply the same interest rate over that!
This is a commonly used diversion and distraction tactic by Greenpeace, Joe Romm and Tyler Hamilton, it has happened before, I’m having a big deja vu right now:
http://energyfromthorium.com/forum/viewtopic.php?f=11&t=1672&st=0&sk=t&sd=a&start=45
I think it’s really helpful to provide comparisons on this basis, and evaluations of proposed and established power plants.
A few suggestions for revision:
– You need to provide a better citation for 63.1% capacity factor on Gemasolar plant (besides a blog post from a software engineer on the energy collective site). There are plenty of others that report 75% as the estimated projection. Among them, a fact sheet from developer Torresol dated Sept. 29, 2011 (see page 2), and heliostat producer and technology supplier Sener dated June 25, 2010 (page 4). It’s not exclusively “excellent desert siting” that accounts for high capacity value (as Nathan Wilson suggests) but technology potential and efficiency of molten salt thermal storage (as well as a resource potential of 270 days of productive sunlight). Others may take this at face value, but I need additional clarification (especially if we are going to discount Terresol and Sener fact sheets).
– Regarding LCOE calculations and “economic lifetime” projections, you are not using comparable (or generally accepted) reference baselines. From MIT study on The Future of Nuclear Power (2003 and 2009): “The levelized cost of electric generating plants has typically been calculated under the assumption that their regulated utility owners recover their costs using traditional regulated utility cost of service cost recovery rules. Investments were recovered over a 40 year period and debt and equity were repaid in equal proportions over this lengthy period at the utility’s cost of capital, which reflected the risk reducing effects of regulation” (2003, p. 39). Economic lifetime and plant lifetime (as used in LCOE calculations) are not the same thing. The MIT study takes issue with this one sized fits all “traditional” model, and adjusts it with two capital recovery periods (25 year and 40 year), and two lifetime capacity factors (85% and 75%). What happens after this period is not relevant to LCOE calculations, and you have not included any comparable extended plant life guidelines for any of the other technologies (some of which have plant lifetime estimates of 30-40 years, but at reduced capacity factors). A capital cost recovery factor of 60 years would significantly increase capital, O&M/regulatory, and financing costs for nuclear plants (there are a great many considerations you are overlooking by making this faulty comparison … all of which impact LCOE kWh projections). IEA and OECD-NEA use 40 year “economic lifetime” and 85% capacity factor reference baselines. NREL agrees: “Typically LCOEs are calculated over 20 to 40 year lifetimes.” You appear to be conflating total or whole life-cycle costs (LCC) for nuclear with levelized costs of energy (LCOE) for renewables.
Zvyozdochka (@Zvyozdochka), on 22 October 2011 at 12:14 PM said:
4. What is the refueling interval of an EPR – how long is it offline for at what separation of years and where does the backup come from?
The refueling in the US at least is scheduled for seasonal off peak.
Total electricity consumption in the US in April 2010 was 287,000GWh. In July 2010 409,000 GWh. Since April demand is generally 25% less then July 25% of the plants can be offline in April.
http://www.eia,gov/totalenergy/data/monthly/pdf/sec7_5.pdf
Zvyozdochka (@Zvyozdochka), on 22 October 2011 at 12:14 PM said:
2. If I’m the operator of an extremely modular plant, I can push past 25 years replacing bits that are failing (ie wind turbines, gearboxes, PV modules and field components in CSP). I’m not repurchasing ground work or foundations necessarily.
US Cost estimates for windfarms. Page 35 Table 2 – breakdown of costs.
http://www.nrel.gov/docs/fy07osti/40566.pdf
In a theoretical 1.5 MW on shore wind turbine with a total project cost of $1.4 million the foundation costs $46,000. Roads and civil work adds another $79,000. The ground work and foundation work is less then 10% of the total cost.
Since I don’t subscribe to Climate Spectator I couldn’t access the link in the article to the proposed 120 MW biomass backup plant for the Yorke Peninsula wind farm. However a scanned copy of a local newspaper article is here
http://www.syngas.com.au/staging/images/110907%20syngas%20talks%20on%20biomass%20energy%20plant.pdf
It turns out the biomass is chaff presumably the byproduct from local wheat and barley cropping but it may be too expensive. In that case they may open up a small coal deposit in the area!
If the 600 MW nameplate wind farm had a firm capacity of say 60 MW then full dispatchable backup would be 540 MW not 120. Chaff can be used as animal feed or the uncut wheat straw can be left in situ as mulch for direct seeding in no-till farming. The latter is called ‘stubble drilling’. Chaff needs a lot of diesel for tractors and trucks to harvest and transport. Realistically I think the biomass backup plan is a greenwash and backup will be existing gas fired plant not on the peninsula. However SA’s main gas source Cooper Basin will expire in 2023.
This makes me wonder if the Yorke Peninsula locals can put up with a massive wind farm and messy hay burning power plant they could put up with a neat compact nuke plant. The underwater cable idea stays. The good thing about the YP coastline is that it doesn’t have the mangroves and saltmarsh like the Pt Augusta area. For demographics see http://en.wikipedia.org/wiki/Yorke_Peninsula
http://bravenewclimate.com/2011/10/21/tcase15/#comment-139236
cyril: small question. why do the numbers you present above differ slightly from those in the energyfromthorium site?
425 kwh to 393; 25 to 18 for solar?
Cyril R @ 22 October 2011 at 10:26 PM
You are disagreeing with EPRI, ACIL-Tasman and other authoritative reports that explain how LCOE is calculated.
And you have not been able to say what is wrong with the EPRI report, despite me asking you several times to address it specifically.
I am asking you to focus on the EPRI report because it provides sufficient information to allow us to check the calculations (mostly). I do not have the full background to the Euro figures you are providing so I fear they may be only part of the story, just as VC Summers 2 & 3 figures provided initially were only 55% of the total cost. Your figures may be a case of “monkey business with numbers” for all I know. So can we please work with the EPRI report and numbers.
The EPRI (2010) report the EPRI (2006) report and the ACIL-Tasman (2009) report all explain that LCOE has to be calculated on the Total Capital Required at the end of construction. This includes Owner’s Costs and Interest During Construction (IDC or AFUDC). The Overnight Costs do not include interest during construction or owners costs.
The discount rate in the calculator calculates the interest accumulating on the capital balance owing (Total Capital Required at the start of operation plus accumulated interest less the amount paid off so far) is paid down over the book life of the plant.
I am still persuaded EPRI and ACIL-Tasman are correct – they are experts in the field after all – and you are the one with the misunderstanding. If you want to persuade me that I have the misunderstanding, could you please explain where the error is in the EPRI report.
Cyril R,
Look at Table 7-7 http://www.ret.gov.au/energy/Documents/AEGTC%202010.pdf to see what items are included in the Total Plant Cost. Interest During Construction and Owners costs are not included. As the EPRI report explains these are to be added to get the Total Capital Required.
For nuclear, the costs are:
Total Plant Cost (or Overnight Cost = $5,742 = $71/MWh
IDC and Owner’s Costs = $5,358 = $66/MWh
Total Capital Required = $11,100/kW = $137/MWh
The LCOE figures are calculated using 30 year book life, 8.4% discount rate, 85% capacity factor.
EL @ 3 October 2011 at 4:23 AM
The lead article included the link to the NREL summary sheet for Gemasolar http://www.nrel.gov/csp/solarpaces/project_detail.cfm/projectID=40 . This was updated (partly) on 7 September 2011.
What NREL did update is the revised capacity, now 19.9MW up from 17 MW in previous.
What they did not update is that the plant is not longer inc construction, it is now in operation, and they have not provided the final cost of the plant. They are still showing the cost that was forecast in Feb 2009 at the start of construction, i.e. 230,000,000 Euro. Barry’s link says the final cost is UKP 260 million or about 300 million euro, or US$413 million
Cyril R. — Thanks for the presentation of the difference between overnight and total capital costs.
This is precisely the kind of beautiful clear post that people need in day to day arguments with friends, colleagues, enemies … I’ve been meaning for a long time to chase the cause of the Finnish EPR cost
overruns, they are worse than embarrassing … people often draw the unwarranted assumption that anything with a huge cost blowout, must be hugely expensive, and anything under budget must be cheap.
So, has anybody chased down the reasons for the cost blowout? The Reuter link in Barry’s post isn’t very enlightening … “he said, she said”. Could it simply be delays that have caused the blowout? Or is it something more significant? Like redesign work … software failures … etc.
@Geoff Russell,
This report from the UK Royal Academy of Engineering discusses a number of current nuclear builds including the EPR in Finland:
http://www.raeng.org.uk/news/publications/list/reports/Nuclear_Lessons_Learned_Oct10.pdf
It’s a good read. Some of the reasons for delay include FOAK, design changes after commencement of construction, use of sub-contractors without sufficient experience of the special requirements of nuclear construction, issues with project management, possibly a picky regulator who sometimes did not act in a timely manner.
I’ve never seen it mentioned anywhere, but I sometimes wonder about the climate. It surely can’t be easy working outside in the middle of winter.
Geoff Russell — Some blaim the ‘inexperienced Finnish regulatory agency. Given that Finland has had NPPs for a long time I find that hard to fully credit. However, Areva is sueing former partner Siemens for about 600+ million Euros for Seimens failure to do their part of that first EPR build.
I’ll chalk it up to starting to construct and then discovering some of the advanced features had difficulties. And there is more, having to do with such standard civil cosntruction matters as properly formulating the concrete. Altogether a difficult project and hopefully the experience will not be repeated.
Geoff Russell, on 23 October 2011 at 8:40 AM said:
So, has anybody chased down the reasons for the cost blowout?
A fairly detailed academic review of what went wrong at Olkiluto done by Aalto University Finland. Problems with concrete, problems with sub-component manufacturing, regulatory problems, work practices problems, imported polish workers not being able to communicate with Finnish counterparts..etc..etc..etc.
http://crgp.stanford.edu/events/presentations/CRGP_Alto_2010/Case_1/Olkiluoto_3_case_workshop_1.pdf
Just to put the Finnish EPR cost blow-out (by a factor of two) in perspective, remember that the estimated cost of Gemasolar increased by a factor of four between 2005 and 2009.
EL the 63.1 % capacity factor for Gemasolar does not come from a blog post, it comes from the projected output on the NREL site. Do the calculation yourself to verify. I always do…
For book life of nuclear I used 30 years, not 40.
Please read my posts more carefully in future so as to avoid erroneous critiques.
Adding another datum for wind power, a small wind farm recently completed the contract to suppy Idaho Power with an LCOE of US$0.090/kWh. That does not include the production incentive which the state of Idaho might (or might not) add in. If the project were in Washington state instead, the taxpayers would throw in another US$0.021/kWh, payable to the wind farm operator.
Nearly every article on wind or solar installations refers to the number of homes they can power, and virtually every time the numbers are ridiculously inflated. This being a pet peeve of mine, I once ran the numbers for the USA and figured out how many homes could be powered per MWe even if all of it was actually going to homes, and none to industry or business, which of course isn’t the case anywhere but would give a result of the maximum number of homes possible in a 100% residential area. Just trying to give the benefit of the doubt to the claimants. Even so, the numbers that you normally see are still absurd. Here’s the rundown from when I was running the numbers claimed for a 754 MWe Arizona solar project:
——————————————
How many homes can be powered by a power plant of X MW?
For the statistics below, see http://www.census.gov/hhes/www/housing/ahs/ahsfaq.html
Q. How many housing units are there in the United States?
• A. There were 128,203,000 housing units in the United States in 2007. Approximately 110,692,000 were occupied as regular residences and 17,511,000 were vacant or seasonal.
So that means there are almost exactly 3 people per home (if you consider regular residences)
————————————————————-
From http://coal2nuclear.com/energy_facts.htm
In 2005 the United States consumed 4.04 billion megawatt hours (mWh.) of electric energy. Dividing that by the 296 million people then in the United States then gives an average annual consumption of 13.6 mWh per American, about 1,550 watts, 24 hours a day. At $81 per mWh, a year’s supply of electricity cost $1,100. Over an 80 year lifespan, a lifetime supply of electricity would cost $88,300.
————————————————————-
Average annual consumption per capita in the USA was 13.6 MWh in 2005. 3 people per home. That would require about 40 MWh per home annually, or .040 GWh.
So how many GWh do you get per 100MW capacity?
24 hours/day x 365.25 = 8766 hours/yr.
8766 hours x 100MW = 876,600 MWh, or 876 GWh/yr.
If one home requires .04 GWh/year, 100MW power plant will provide for the needs of about 22,000 homes assuming it’s running at a capacity factor of 100%.
754MW x 25% cap fac (generous, since AZ gets only about 19%, see http://www.treehugger.com/files/2008/03/solar-versus-wind-power.php ) = ~ 188MW, enough to power about 41,360 homes. The article says 566,000 homes, an exaggeration of about 14 times!
———————————————-
If you look at the home numbers on the above projects Barry cites, you see the same sort of absurd exaggeration. The fact that this hyperbole is standard procedure in the wind and solar industry is a good indication of just how desperate their advocates are to pitch a losing proposition. Of course many countries use less electricity per person than in the profligate USA, but most of these numbers are from US projects and US articles, and even if not the exaggerations could most accurately be described as lying.
Every time I’ve tried to ferret out the actual production data from wind or solar installations, i.e. the number of MWh of electricity produced per year (not the projected output, but the real output) I’ve run into a stone wall. If anyone has such data from a time scale of at least one year (to take into account all seasons and weather conditions), I would really appreciate it if you’d post it here for all to see. The fact that it’s so hard to come by doesn’t speak well for the accuracy of the industries’ claims.
Tom Blees — BPA, somewhere on their voluminous website, has apaper showing that the wind farms for which BPA is and has been the balancing authority produced, as a sveral year average now, at about 26% CF in an area, the Columbia Basin, which claims a maximum CF of 30%.
I think in correct to generalize by wind region. If the region claims a maximum CF of X% use (X-4)% CF against the nameplate rating to obtain the actual energy produced over sufficiently long intervals.
Thanks for that, DBB. It would be interesting—and revealing—to see that graphed/charted by the day. I once saw a graph showing electricity demand somewhere in Texas (by the hour) versus wind supply, and it was uncanny. The peaks and valleys were nearly completely reflective, which is to say that peak demand corresponded almost exactly with lowest wind supply.
Tom, regarding real-world performance data on solar thermal, did you see this BNC post from a while back?
http://bravenewclimate.com/2011/07/03/lacklustre-colorado-solar/
Conclusion – significantly below expectations…
Tom Blees — Here is the BPA production by generator type together with local demand updated every 5 minutes:
http://transmission.bpa.gov/business/operations/wind/baltwg.aspx
To me, after following this for about a year now, the wind appears fairly uncorrelated with the time of day (and of course the demand is well correleated with the time of day.)
Regarding the delays in OL3 NPR. I think one of the main issues has been that the design of the EPR hadn’t really been finished when Areva sold it.(see: http://yle.fi/uutiset/kotimaa/2011/10/olkiluoto_3n_suunnittelu_huolestutti_jo_aiemmin_2958902.html page is in finnish, but the letter under “Laaksosen kirje Lauvergeonille 9.12.2008 (engl.)” is in english. Especially the design on control and protection systems hadn’t been done when the project started, Under such circumstances it is clear, that the schedule can be very different from what was promised. Currently the owner of the plant (TVO) warns that start of the regular operations might be delayed until 2014. The delay is caused by unfinished design of the control systems.
Thanks everybody for info on Olkiluoto cost-overruns.
Peter Lang, you’ve done the double counting error again. The IDC is on a seperate loan – so you can’t add it in the NREL levelized cost calculator as overnight cost, as that would be charging interest rates twice. That’s not how you calculate levelized costs.
I suspect, but am not sure, that the EPRI report also makes this mistake, because their levelized cost is too high if you enter the overnight cost, as it should be done. They appear to lump in all project costs as overnight costs and then do the double counting interest rate trick that anti-nukes are so fond of. I don’t doubt the EPRI capital figures, but their levelized cost figure makes no sense at all.
Tom Blees,
Here are some charts for average wind production in the US PNW and year of wind installation.
http://www.nwcouncil.org/energy/powersupply/Default.asp
The LCOE of over 29 cents for the CSP project in Spain also looks somewhat high, since the feed-in tariff seems to be only 20 cents Euro.
Interview with secretary general of Spanish solar industry association from September:
http://social.csptoday.com/qa/spains-csp-powering-toward-conventional-power-price-parity
He said that people were lining up for doing projects at 20 cents, which he says is “artificially high” and the government put a 500 MW cap on the successful projects. He also expects the FIT to fall to zero until 2020.
Another obvious point he made is that when comparing LCOE of PV and CSP you need to factor in that CSP already comes with CO2 free storage built in.
That would be a 500 MW cap per year, but much bigger a problem is the 50 MW cap on individual projects. That’s suboptimal. Steam turbines are sweet around 200-400 MWe.
Funding expensive and unproductive energy sources such as CSP requires a hefty budget, and Spain realizes it can’t afford what Germany is doing. So they are cautious. But the result is rather half-baked. It reminds me of the country I’m in right now. Half-baked pies in the sky, such as trying to build fancy offshore wind farms with insufficient subsidies, is what we are doing here. The result is that we are also building a humongous coal fired power station in the northern harbor of Eemshaven. It is what we get for having fantasy and emotion as energy policy.
I found this excellent article by Willem Post on the Energy Collective which describes the recent performance and numbers of the Spanish PV and CSP systems. Conclusion, CSP performs much better than PV due to energy storage, but neither are even remotely economic (and that’s quite an understatement!). Spain cannot phase out the FITs as that would sink the entire Spanish solar sector.
http://theenergycollective.com/willem-post/46824/impact-csp-and-pv-solar-feed-tariffs-spain
Texas data is posted by ERCOT at http://www.ercot.com/gridinfo/generation/windintegration/ … I’d cherry pick August 11 to the most blatant of inverse relationships between wind and demand – but any hot week is likely to show a similar graph.
I think Australia should heed the Texas experience more than others, because the ERCOT grid is, surprisingly, very isolated. A review of Texas’ very pricey August, where mothballed units where recalled to service to meet demand, is here: http://www.eia.gov/todayinenergy/detail.cfm?id=3010. That link notes the FERC (federal) forecast prior to the summer, which declared ERCOT would have adequate reserve margins, but, as the lowest reserves in the country, and shrinking, “would be most
affected by significant changes to available generation or demand forecasts.”
This seems very similar to the European grid operators, via the ENTSOE-e entity, noting the upcoming winter may be problematic:
https://www.entsoe.eu/media/news/newssingleview/article/european-tsos-concerned-about-system-adequacy-for-this-winter/
I think another limitation of the calculations here is not recognizing the declining CF of IWT’s. I thought this was broadly acknowledged. For instance, in Ontario we have adjacent groups, by the same company, built 2 years apart. And the CF’s are consistently about 2% different. And this seems universally true – the highest CF’s are at the newest installations – only until there are newer ones again as the older ones continue to drop.
@Tom Blees: If you are interested in real production data for wind which can be downloaded easily:
BPA was already mentioned.
Denmark: I think hourly data http://energinet.dk/EN/El/Engrosmarked/Udtraek-af-markedsdata/Sider/default.aspx
Ireland: every 15 minutes together with prediction http://www.eirgrid.com/operations/systemperformancedata/windgeneration/
South-Eastern Australia: every 5 minitues http://windfarmperformance.info/
For spanish grid you can also find the current production data, but I think there was no easy way to download the data into a file.
David B. Benson, on 23 October 2011 at 11:19 AM said:
Adding another datum for wind power, a small wind farm recently completed the contract to suppy Idaho Power with an LCOE of US$0.090/kWh. That does not include the production incentive which the state of Idaho
There are generally two primary options large wind developers have for subsidy in the US. The ‘production tax credit’ which is 2 cents/KWh for 10 years or a ’1603 grant’ which is basically a direct 30% subsidy of project costs.
Thanks for those links Jani, very useful real data for whole countries. The typical wildly swinging behaviour of wind generation can be clearly seen within and especially between different days and weeks. A simple consequence of the cubed power law of power production with wind speed.
The Capacity Factor also has a great post on this with two graphs showing all wind power in Germany and compared to a typical nuclear fleet output in a US grid:
http://uvdiv.blogspot.com/2010/03/uptime-downtime_07.html
Really shows the problem of wind and the benefit of nuclear in one glance.
Cyril R @ 23 October 2011 at 8:35 PM
You are making assertions but not backing them up. You seem to want me to accept that you are correct but the recognised experts in the field don’t know what they are doing. EPRI (2006), EPRI (2010), ACIL-Tasman (2009) all explain that IDC and owners costs must be capitalised and included in LCOE. That is, the “Capital” value that must be entered into the NREL Calculator is the Total Capital Required to be repaid over the book life of the plant. In short:
Overnight Cost (or Total Plant Cost)
+
Owners costs
+
Interest during construction (this interest on the amounts expended during the 3 years of longer construction period
=
Total Capital Required (TPC) to be refunded during the book life of the plant
The calculation of LCOE then applies a Weighted Average Cost of Capital (WACC), or discount rate, to the capital to determine the LCOE.
The fact you have not been prepared to look at the explanation of this in the reports I’ve mentioned (and provided links to) has left me with the impression you do not really understand how LCOE is calculated when done properly.
I’d urge you again to read at least one of the explanations I’ve provided links to and then tell me why you believe they have it wrong and you know better than they do.
EPRI (2010) http://www.ret.gov.au/energy/Documents/AEGTC%202010.pdf
ACIL Tasman (2009) http://www.aemo.com.au/planning/419-0035.pdf
Cyril R,
If EPRI and ACIL-Tasman are doing their LCOE calculations incorrectly, then someone should advise AEMO, Treasury, ABARE, Department of Climate Change and Energy Efficiency, Department of Resources, Energy and Tourism and all the private sector consulting organisations.
All these groups use this LCOE data provided in these consultant’s reports and quote the LCOE figures in government reports. The figures are used in economic modelling and are the basis of policy decisions. If all these groups have not picked up that the reports they’ve contracted have a basic flaw in their analysis methodology, which you believe is the case, why should I believe you know better?
Tom: Here’s a nice example of wind troughs matching demand peaks beautifully … from Adelaide’s 2009 record heat wave.
Peter Lang, with respect, that strikes me as an argumentum ad verecundiam on behalf of EPRI and ACIL-Tasman. If you are happy with such an argument (I see merit in it for authoritative bodies, to be sure), why not make the same argument on behalf of the IPCC, WMO, Royal Society etc. on climate change? One should aim to be consistent.
Regarding these LCOE calculations, I’m honestly not sure who is correct. If you look at the documentation for the NREL calculator, it appears to support what Cyril is saying: http://www.nrel.gov/analysis/tech_costs.html That is, the input is overnight costs only. The definition is:
However, in the WNA “Economics of Nuclear Power“, they say the following:
This seems to partially support what PL is saying, regarding owner’s costs, but not regarding interest during construction.
For the EPRI report for Australia, I wonder if the owner’s costs include provision for greenfield rather than brownfield sites for construction?
The $6 billion costs for the Finnish plant is the total capital costs, which includes the bare plant costs + owner’s cost, i.e. the ‘all-in cost’.
Uhmm … I’ve obviously mucked up the image link in my previous comment, but people can look at page 55 of the following report.
http://www.aemo.com.au/planning/0400-0013.pdf
GR I have another image somewhere that tells the story. Some Adelaide relatives drove to Yorke Peninsula to take the sea air and escape the city heat. At the foot of the cliffs below the Wattle Point wind farm the big turbines weren’t moving. Across the waters everybody who had an air con had it turned up to max. Unless Adelaide can get reliable summer peak power air conditioning will have to be rationed. Melbourne outskirts hit 48C that year Adelaide can’t be far behind in future.
Follow up thought; we are only a couple of issues away from serious public discussion of energy issues. First is petrol over $2/L and the second is a return to El Nino weather patterns.
I too am very annoyed at “households” becoming metric number 1 for the performance of energy projects. Could there be anything that tells us less, is more subject to variable assumptions, or more easily leveraged away from reality?
Hence the value of this post, among other great information. It’s yet another ready response you have given me when the Finnish experience is raised. Smart thinking to choose the flagship “failure” of NP for your comparison, a FOAK construction in a developed, high labour cost nation.
Great post – particularly interesting that Olkiluoto (a bit of a thorn-in-the-side for the nuclear industry in terms of cost blow-outs) still ended up coming out least-cost.
I’ve also followed the conversation between Cyril R and Peter Lang with some interest. Perhaps someone should send NREL an email to ask what their assumptions are re. “Capital Cost” inputs? They only state overnight costs in the supporting documentation. But owners costs and interest during construction have to be factored in somewhere.
My lay understanding is that either the calculator makes assumptions about owners costs and interest based on overnight costs and includes these in the calculations (unlikely?), or you actually need to enter (what Peter Lang is referring to as) Total Capital Required as the Capital Cost input.
So I guess the questions are, are owners costs and interest already implicitly included as part of what NREL are calling over night costs? And do over night cost figures usually include owners costs and interest during construction?
Barry,
Two comments in reply to this opening paragraph:
Firstly, I agree my argument was “argumentum ad verecundiam” . I was getting frustrated because I’d pointed many times to the EPRI report sections 4 and 5, suggested people read it because it describes the methodology for calculating LCOE, and say where it is wrong. My last comment, that you picked up on, was after my several previous attempts were apparently ignored. So yes, I did succumb, finally.
.
Secondly, you and most readers on BNC have misinterpreted my position on CAGW. But it is not a topic that is allowed to be discussed on BNC and even if it was, I don’t believe it could be because of the enormously high level of emotions and name calling that goes with any attempt to discuss it.
Now to the substantial part of your comment.
I agree with that statement. But it does not say that “Overnight Cost is equal to “Total Capital Required”. The next sentence explains how you get from Overnight Cost to Total Capital Required”
This is correct. Total Capital Required is: Overnight Cost + Owners Costs + Interest During Construction (AFUDC).
The WNA statement is not ver clear.
I extracted from the EPRI report relevant paragraphs and sentences that explain this and posted it on Open Thread 19 here: http://bravenewclimate.com/2011/10/15/open-thread-19/#comment-139008
I’ll post it in a separate comment below to help readers and hope you will allow the duplicate post.
I also dig up some other references that explain it clearly – but later. I think the EPRI and ACIL Tasman reports explain it clearly. See nect comment for a start.
MODERATOR
New and current information on AGW may be and still is discussed on BNC but not unscientific, re-hashed sceptism of the scientific consensus on the topic. Now the blog is moderated, emotional outbursts and name calling are deleted.
I believe I’ve found the reason for the discrepancy between the LCOE figures I calculated for VC Summers and the LCOE EPRI stated in the link provided by Harrywr2. The discrepancy is because the VC Summers capital cost figure we used includes the owner’s costs whereas the EPRI figure for Australia does not. That is, the VC Summers capital cost figure is for Total Funds Required (TFR) whereas the EPRI figure (e.g. in Table 9-2) is for Total Project Cost (TPC). I’ve back calculated the owner’s costs it seems EPRI used; it seems TFR is almost twice TPC in the EPRI report. I’ll provide the figures in a separate comment. In the meantime, I’ve extracted some relevant sections from the EPRI report for Australia http://www.ret.gov.au/energy/Documents/AEGTC%202010.pdf . These will help to understand the basis of the capital cost figures.
I’d urge anyone interested in understanding this to read Sections 4 and 5 of the EPRI report:
http://www.ret.gov.au/energy/Documents/AEGTC%202010.pdf
What EPRI does not give is the actual figures that would allow us to calculate the Total Funds Required (TFR). So I’ve done a rough back-calculation to work out what EPRI used for the owner’s cost. Hold your breath – it’ll be in the next comment (but perhaps not today 🙂
The NREL sLOCE calculator requires only entering a figure in $/kW for “Capital Costs”. From the documentation (available towards the bottom on the right, NREL’s calculator takes these to be overnight captial costs. Therefore a careful calculation requires converting all costs into overnight capital costs for the night before the generator begins producting on grid.
As actually making such a conversstion is quite tedious (to say the least), for NPPs I use the construction contracts as given by World Nuclear News as US$/kW and then multiplying by 1.25-1.4 to obtain total overnight costs, depending upon the particular project. Experience has shown that this method gives results which are good enough for the purposes of comparing to alternate generation methods; as as the mortgage term is 30 years the sensitivity is low. For example, using the construction costs to be paid to Westinghouse for VS Summer of US$3900/kW, the extremes of the above multipliers result in a sLCOE of US$0.095-0.103/kWh for the 30 year lifetime of the loan.
Since it takes about 5 years to build a Westinghouse AP-1000, maybe it is better to consider the payback period of the mortgage as being but 25 years. Then the sLCOE range is US$0.097-0.106/kWh; only a little more.
All these various sLCOE estimates are quite close to the ‘actual’ sLCOE of wind farms regionally once the production credit is included in the sLCOE. Obviously the quality of power (QoP) for NPPs is much better, although nobody seems prepared to come forward with a quantitative method of determining QoP.
This may be interesting. Using the EPRI projections for new electricity generation technologies built in Australia, I’ve calculated the ratio of Total Capital Required to Total Plant Cost (or Overnight Cost);
Coal (black no CCS) = 1.48
Coal (black w CCS) = 1.48
Nuclear = 1.93
CCGT = 1.88
OCGT = 1.39
Wind (class 5, 100 x 2 MW) = 1.30
CST (Central Receiver, 6h storage, DNI = 6) = 1.41
For nuclear, the total capital required is 93% higher than the ‘Overnight Cost’. For most other technologies capital required is about 40% to 50% higher than the Overnight Cost.
Since the Capital cost component comprises 80% of the LCOE for nuclear, it would seem this is the place to focus attention if we want to see where we could reduce LCOE for nuclear. The Owners Costs and AFUDC are adding 93% to the to the total capital cost of the plants (based on EPRI’s figures).
I’ll go looking for a good reference to explain what the capital component of LCOE requires. But in the meantime, here is another way to think about it:
If the NREL calculator was calculating the interest during construction and the owneres costs, it would need data entry for:
– construction period
– owners costs
– interest rate to be applied to these during construction.
The interest rate that applies on borrowings during the construction period is no the same as the discount rate or “Weighted Average Cost of Capital” that will apply during the operating life of the plant.
The NREL Calculator documentation http://www.nrel.gov/analysis/tech_lcoe_documentation.html says:
I believe this is misleading. I think they are using the term “Overnight capital cost” to mean all costs including Owenrs costs and IDC that have accumulated up to the time the plant begins producing selling electricity to the grid. This is not what I undestrand Overniht Costs means to most people. It is certaibly not what EPRI or ACIL-Tasman mean by Overnight Costs.
I’m still looking for a good reference.
Peter Lang — Yes, to use the NREL calcualtor accurately, all capital costs must be brought forward to the overnight point, just before productive generation begins. That’s precisely what I posted earlier.
Footnote 2 “Overnight cost” is an estimate of the cost at which a plant could be constructed assuming that the entire process from planning through completion could be accomplished in a single day. This concept is useful to avoid any impact of financing issues and assumptions on estimated costs. Starting from overnight cost estimates, EIA’s electricity modeling explicitly takes account of the time required to bring each generation technology online and the costs of financing construction in the period before a plant becomes operational. from
http://205.254.135.24/oiaf/beck_plantcosts/
Page 10-5 in this EPRI report
http://my.epri.com/portal/server.pt?space=CommunityPage&cached=true&parentname=ObjMgr&parentid=2&control=SetCommunity&CommunityID=405 says:
Capital Cost Estimate Summary
TCR = TPC + project specific costs + AFUDC
TCR is typically 16% to 19% higher than TPC
Owners costsd add about 5% to 7% to TPC
Interest during constructrion adds another 11% to 12% to TPC
Project specific costs vary widely, typically 10% to 15%
Since EPRI says TCR (i.e “Capital”) is typically 16% to 19% higher than TPC (i.e Overnight costs”) I have no idea why the EPRI (2010) has TCR at 93% higher than TPC for nuclear and around 40% to 50% higher for most of the other technologies.
The EPRI (2006) report for the UMPNE report explains what is included in Capital in Figure 2-1 (page 2-8): http://pandora.nla.gov.au/pan/66043/20061201-0000/www.dpmc.gov.au/umpner/docs/commissioned/EPRI_report.pdf
This is definition different (slightly) from the one EPRI used in its 2010 report. However, the methodology is still the same. All costs including up to the time of the start of commenercial operation must be capitalised – i.e. included in the “Captial” line that must be input to the NREL Calculator.
ACIL-Tasman (2009), p20 http://www.aemo.com.au/planning/419-0035.pdf says:
I presume they do not need to input the IDC in the base year dollars because they have a sophisticated model that calculates the IDC from all the inputs and their timing. However, when using the simple NREL calculator we don’t have the ability to do all that. So we must enter the capital as the total of all the costs up to the date of commercial operation in the appropriate year dollars. Therefore, we do need to include IDC, owners costs etc. The EPRI (2010 report for the Australian government explicitly excludes these costs from their figures for “Total Plant Costs”. So these extra costs must be capitalised at the date of Commercialisation and must be added to the Total Plant Costs to get the “Capital” figure to enter into the NREL Calculator.
I think this is now solved. Does anyone disagree?
Peter Lang, on 24 October 2011 at 4:46 PM said:
I have no idea why the EPRI (2010) has TCR at 93% higher than TPC for nuclear and around 40% to 50% higher for most of the other technologies.
IMHO The productivity adjustments for Australia ends up having a double effect. They increase the project cost but also increase the build time which then increases construction financing costs. Since nuclear has the longest build time the impact is most pronounced on nuclear.
Harrywr2,
I think your comment focuses on the most important component of nuclear’s LCOE. I believe it is very important we get to the bottom of what is making the capital cost of nuclear:
– higher in Australia than in USA, and
– higher in USA than in Korea and China
IMO, only part of this is due to labour rates and productivity. I think the main difference is sovereign risk, investor risk premium and laws and regulations that tip the field against nuclear compared with renewables and fossil fuels. All of these can be dealt with by legislation and fixing regulations. But first we need to identify all the culprits.
am not sure that the construction time is the cause of this. It is not clear what construction duration EPRI have used for their calculations. They don’t state these assumptions However, thye imply they arew using a 36 month construction time. The plants size used in the analysis is 1117 MW which implies it is the AP1000 plant. At the bottom pf page 6-7 they say the construction period is approximately 36 months. However, this is certainly an assumption that we need to know.
Unfortunately, EPRI does not spell out all the individual cost items in the 93% loading which they have added to ‘Total Plant Cost’ to get the figure for ‘Total Capital Required’.
I hope, somehow, we can get details about what makes up the 93% loading.
At 20% loading, CO2 abatement cost for nuclear would be about the same as new CCGT.
However, we still have the issue of high cost electricity to deal with. So I advocate the Australian government should take a “forensic accounting” approach to determine what are the impediments to low cost nuclear in Australia, which could be removed, what is the priority for removal, how could they be removed and what would be the time line for doing so?
BNCers could start the ball rolling on this.
Harrywr2,
I should have begun my last comment acknowledging that I agree with this statement.
If we cannot do anything about the lower productivity and higher labour rates, it would seem nuclear cannot be competitive in Australia.
I wonder how the korean consortium is addressing the issue of labour productivity for the UAE NPP?
Texas may be looking to increased energy storage deployments as one way to address issue and reinforce grid. Previously, generators owning storage equipment had to buy electricity at retail rates, and sell it at wholesale rates (not a very good deal for them, or consumers). Bill S.B. 943, signed by Rick Perry this August, clears the way for storage developers to be re-classified as generators. Texas currently has a 4 MW sodium-sulfur battery in Presidio (which can power the town of 4,000 for eight hours). Duke is looking to add 36 MW battery (by Austin based Xtreme) to it’s 153 MW Notrees Wind Farm, and AES a 100 MW battery for peaking power to El Paso Electric. ERCOT has two powerpoints looking at AES and A123 storage systems. According to Platts Global Power Report, “Large-scale energy storage is poised to make its debut in Texas … with more than 180 MW planned in 2012″ (subscription only, Sept. 01, 2011).
EL,
To give wind power the same availability as fossil fuel and nuclear generators, the capital cost (using Barry’s figures from the lead article) would be:
Wind generators = $6.9 billion/GW
Assume we need 1000 hours storage capacity per GW to allow wind to generate at its average capacity factor throughout the year – even through out the low wind season and extended lulls. A rough cost for battery storage capacity for large scale applications is >$100/kWh http://www.electricitystorage.org/technology/storage_technologies/technology_comparison
Energy storage = 1 GW x 1000h/GW x $100/kWh = $100 billion/GW
Therefore, the cost to make wind and energy storage into a fully reliable, dispatchable generator with availability equivalent of the baseload generators would $106.9 billion/GW.
No matter how you argue about these figures, we’d need to get the total cost of wind and energy storage down to less than the cost of the wind generating capacity alone to make it viable.
Peter Lang, on 25 October 2011 at 5:20 AM said:
I wonder how the korean consortium is addressing the issue of labour productivity for the UAE NPP?
They are probably bringing their own labor and own works rules. UAE doesn’t have an income tax. Most countries don’t tax on foreign earnings. When I lived in Saudi Arabia there were plenty of South Koreans happily working 7 days a week for the same Gross wages they would get at home. They lived in a company dormitory, ate in the company cafeteria and after a few years went home with enough savings to buy a house.
An alternative storage technology is underground pumped hydro. The LCOE (in US cents/kWh) is 8 + P/0.8 where P is the price of power purchased. If purchased form a (winf) generator @ 9 cents/kWh the LCOE busbar cost to distributors is 19.25 UScents/kWh. Not only is that fairly expen$ive energy, but also a underground pumped hydro scheme typically only has enough capacity for the diurnal cycling.
What do you think about 5 hours (plus some low emitting operating reserves and a very large balancing area)? We don’t need energy storage generators that operate at baseload configurations for a full 24 hour or multi-day cycle. We need cost effective energy storage options for immediate, short-term and mid-term applications. According to one review, “BESS [Battery Energy Storage System] seems to be cost effective when designed for storage less than 5 h … batteries storing modest amounts of power and delivering for seconds/minutes seem to be commercially successful. The immediate success of BESS in rapid and short term applications is because of their capability to react instantly to system disturbances, which a conventional synchronous generator cannot do” (p. 517). Another study looks at scheduling intervals (intra-hour, intra-day, day-ahead, multi-day and seasonal) and storage requirements on a modeled system with high wind penetration (to 57% of total generation). “It can be seen that while all the storage technologies are suitable for intra-hour and intra-day/day-ahead balancing, only some are suitable for responding to several days with high or low net load and even fewer for seasonal electricity storage” (p. 323). I would hope we still have a grid, peak energy pricing, rolling blackouts, or even some cost effective CAES to get us through those rare instances of very long multi-day or seasonal fluctuations?
If competitiveness is an issue (on an isolated system as you are suggesting), what are the costs for nuclear if we want them to operate as intermediate or peak load generating plants? How much overcapacity would we have to build, at what reduced capacity factor, and how much storage would we need to cover intra-hour, intra-day, and multi-day variations (and at what costs)?
EL — NPPs energizing my reference power grid run an an average CF of 84%. That gives an LCOE of US$0.112/kWh assuming captial costs are US$5460/kW.
@EL,
Another study looks at scheduling intervals (intra-hour, intra-day, day-ahead, multi-day and seasonal) and storage requirements on a modeled system with high wind penetration (to 57% of total generation).
The Study was done for Denmark.
Here is another study done for Denmark
http://www.cepos.dk/fileadmin/user_upload/Arkiv/PDF/Wind_energy_-_the_case_of_Denmark.pdf
But Denmark’s special circumstances make its experience of limited
transferability elsewhere…………..Denmark manages to keep the electricity systems balanced due to having the benefit of its particular neighbors and their electricity mix. Norway and Sweden provide Denmark, Germany and Netherlands access to significant amounts of fast, short term balancing reserve, via interconnectors. They effectively act as Denmark’s “electricity storage batteries”.
EL,
You asked me:
In response Id ask you “well what do you think” I’d urge you to have a go yourself. Have a go and doing rough costing as Barry has done in the lead article and as David Mackay urges people to do in his book “Sustainable Energy – Without the hot air” – he defines the purpose of his book is to assist people to “cut the emissions of twaddle about sustainable energy”.
Well, if you just want peaking capacity or shoulder capacity do the cost calculations for that alternative. It won’t solve your cost problem. You still need a lot of storage. For example you need to be able to provide the 1 GW capacity on demand, for as long as required to meet your contracted obligations for availability, during extended lulls and throughout the low wind period. The size of the balancing area (actually the size of the area of the distributed wind farms) is nearly irrelevant in practice as is shown by the long periods of becalmed conditions over the whole of the 800 km by 1200 km area over which the NEM wind farms are distributed – e.g. 6 days of virtually no output from the NEM wind farms in May 2010.
Furthermore, you would still need transmission capacity to carry the maximum output of the wind farms while on average providing only the average output. So transmissions capacity must be about three times the average output, and therefore three times the cost. Actually much more than three times the cost because we also need the additional transmissions length to get to all the remote sites, and we need the costly balancing equipment on all these lines to maintain power quality.
If you have energy storage at the generator you save on transmission costs but have higher storage costs because every generator + storage facility must have sufficient storage to ensure it has the required availability. If you have centralised storage you save on storage costs but incur the high transmissions system costs.
Have a go at doing the cost estimates yourself. Put together a scenario, state your assumptions and explain how you estimate the cost of your proposal.
It is not encouraging to see an academic nit-pick about ‘down in the weeds’ parts of a ‘back of the envelope calculation’ but be unable to recognise that a scenario they propose is uneconomic by a factor of two or more. What I mean is that even if you need only 100 h storage per 1 GW contracted capacity, the cost of your proposal is still $16.9 billion/GW, which is totally uneconomic, especially since 100 h will not give you the availability needed.
EL,
Your comments sugggest you may not have understead the various roles of energy storage. I’d urge you to read the link I provided in my earlier reply to you (to the Energy Storage Association): http://www.electricitystorage.org/technology/storage_technologies/technology_comparison
Finishing up what I posted at 9:35 AM, I forgot to include the reserve requirement which will up the fleet LCOE somewhat; however, that LCOE is for the NPPs still paying off the mortage; afterwards the LCOE is about 4 UScents/kWh so assuming half old and half new, together with the reserve requirement, gives a grand average LCOE of ~8.4 UScents/kWh.
Peter Lang, on 25 October 2011 at 11:13 AM — That is a useful link, which I saved. However, the operating costs for pumped hydro (LCOE) is much too low for new development; it is correct for the older pumped hydro installations, however.
Just saw this article about new base-load gas-fired power stations for Qld.
http://www.brisbanetimes.com.au/queensland/its-a-gas-36-billion-investment-in-queensland-power-plants-20111025-1mhb8.html
$3.6billion for 2 x 500MW power stations.
The original, pre-overrun cost given in the article above for Olkiluoto was 3.7B euros, for 1600MWe, or about AU$3.08B per GWe.
So the capital cost of a new (non-FOAK) 4th gen nuke plant is less than that of a fossil-fuel powered plant, which also requires ongoing fuel purchases, and which will emit thousands (millions?) of times more CO2?
They’ve got rocks in their heads… but I guess that’s the price we all have to pay for decades of scaremongering by anti-nuke protesters.
Er, sorry, just saw something that refers to Olkiluoto as a 3rd gen nuke plant. My mistake.
Hope this isn’t considered too off-topic – I thought it somewhat relevant to the discussion on LCOE.
Bern, on 25 October 2011 at 2:17 PM said:
Just saw this article about new base-load gas-fired power stations for Qld. http://www.brisbanetimes.com.au/queensland/its-a-gas-36-billion-investment-in-queensland-power-plants-20111025-1mhb8.html
$3.6billion for 2 x 500MW power stations.
The article is poorly worded. Further down in the article
The plants will both start with initial investments of $400 million and have a capacity of total 1500 megawatts, meaning a potential capacity of 3000 megawatts.
$1 billion/GW is a fair rough estimate for gas plants.
Just a few thoughts on storage since it’s attracted so much attention here. There is storage and there is storage.
When Helms Pump Storage (1200MWs) was built in the 1980s to act as off-peak storage for Diablo Canyon Nuclear Power Plant (2400MWs) there were several options to consider. They chose the huge expense at Helms for one reason: it could be both an off-peak storage for one night…or for 2 weeks straight, if needed. The upper reservoir was large enough to run for 2 straight weeks at full load before the upper reservoir is drained.
Every…without exception, large scale storage, including those in Texas, are anemic, at best. They are either essentially emergency *short term* back up for load balancing or short duration brown/black outs OR they are used in some forms of CSP so they can say “we can give you 24 hours” (though none in the US can) of power. If low winds for a duration of more than one day or, cloud cover for more than 8 hours ensues, these storage facilities simply run down and that’s that.
No economy anywhere can seriously run based on the total unreliability of short-duration energy storage. It’s delusional. Storage is really only good for *over capacity*, that it.
Every storage facility, bar none, would benefit *greater* from attaching it to an all- or heavy nuclear grid than any other source of energy.
David Walters
It should be stated that we get a great deal more from energy storage on energy arbitrage, operating reserves, frequency regulation, supplement to new transmission and distribution, black-starts, than we do from firming capacity (which is a mid-term application requiring continuous discharge for several hours to days). I agree, the long-range application looks very challenging from an economic perspective given current technology, energy densities, demand profiles, pricing structures, etc. This might appear troubling if I were recommending a system with 100% variable sources, but I am not. We can currently accommodate 30% variable sources with existing resource and infrastructure mix (and don’t need storage as part of the mix). But we’d like to get this higher, and storage can certainly play a role. But before we get there, we have lots of other tools at our disposal before upper technological limits are reached on variable sources: aggregation of loads and reserves, flexible conventional generators, demand flexibility, larger balancing areas, overbuilding renewable sources, new loads to absorb unusable (off-peak) production, and even V2G. In short, storage for mid or long term applications may not be all that important for some time (certainly not in the 1000 hour range you are recommending). So I think you have asked the wrong question (and with the wrong assumptions). Why would we want to pay $106.9 billion/GW with 1000 hours of storage, when $6.9 billion/GW of variable generation will be just fine (and a bit of commercially viable short-term storage for improving power quality and stability, load shifting, arbitrage, reserve capacity, and lowering transmission and distribution costs). And wind as a baseload generator (with CAES and transmission as “an integral part of the analysis”) is not anywhere near your $106.9 billion/GW estimate. In fact, it’s pretty close to wind + CCGT, or coal (with a $35/tC GHG emissions price).
EL, Texas is looking at lots of things, but concentrating most on fighting enforcement of cleaner air requirements the EPA is trying to implement, in order to run old coal plants for longer. There are few generation sources that would not run cleaner if run more consistently – so the question is why would one want to use valuable storage to service unreliable wind output.
The chart on this thread looks very much like the charts from Texas this August, and it’s worse than the wind simply not being very strong at the period of peak demand most days. Most days, wind is ramping down as supply is ramping up, and vice versa.
I reject the implication improved storage would strengthen the wind proposition. For instance, the Queensland natural gas project noted on this thread (as baseload – although I saw no indication of a capacity factor plan) would be more economical if accompanied by storage, because it could run with a higher CF. Similarly, more expensive, cleaner, plants can be built if the can operate at full capacity.
The US EIA reviewed summer electricity prices and found New Engand down 15% from summer 2010, the broad PJM market down3%, New York down 7, the southest down 7, the northwest down 6.
Texas up 113%
http://www.eia.gov/todayinenergy/detail.cfm?id=3530
I see no argument for any capacity that doesn’t contribute to matching peak demand. Quite the opposite. Wind devalues baseload – storage could allow for more of it.
With correct formatting:
In Texas, electricity rates are closely matched to natural gas prices (here and here). This spike has nothing to do with wind resources, but with summer heat wave in Texas, driving up residential electricity demand, and undersupply of market with low (poorly projected) natural gas reserves. In fact, I’d probably guess wind helped the situation rather than hurt it (as it has done in the past when natural gas resources were not available from pipeline breaks, freezing, or other supply interruptions). Developers have also been scaling back production and natural gas reserve requirements in Texas to better “stabilize” natural gas prices after a glut in the market in 2010.
EL, on 26 October 2011 at 7:26 AM said
“2011 Texas summer spot prices”
They had to pull mothballed natural gas plants out of mothballs.
As far as wind according the the AWEA the Texas windfarms were generating 1,800 MW during the heat wave. Texas has over 10,000 MW of wind turbines.
http://www.awea.org/blog/index.cfm?customel_dataPageID_1699=9369
Here is the Texas wind statistics for August 2nd,2011.
http://www.ercot.com/content/gridinfo/generation/windintegration/2011/08/ERCOT%20Wind%20Integration%20Report%2008-02-11.pdf
Then we have the next day…the wind generation was down about 5% of installed capacity at noon.
http://www.ercot.com/content/gridinfo/generation/windintegration/2011/08/ERCOT%20Wind%20Integration%20Report%2008-03-11.pdf
This dicussion of ERCOT’s problems is interesting, but seems off topic for this thread about the LCOE of various low caarbon alternatives. So I’ll instead provide some history of the Texas grid’s woes on the current open thread.
EL, I’m fairly certain the natural gas prices out of Houston didn’t move much – and no supply issues were put on a lack of gas (one link I’ve given noted lower summer prices out of the Louisiana hub).
Going into the summer NERC had noted Texas had 72255MW ‘existing-Certain’ capacity at peak, which included only 820MW of the 9427 of wind capacity (because the trend is known, the expectations of contribution at peak are now below 9% in Texas).
http://www.nerc.com/files/2011%20Summer%20Reliability%20Assessment_ERRATA2.pdf
Actual peak hit 68294 – so the buffer was very thin.
My thesis is that a market will not contain adequate supply if it adds10-15% generation that is expected to make little contribution to supplying peak demand (and is generated on a ‘must take’ basis at all times).
One solution to this may be capacity markets – which pay suppliers for availability (as in PJM in the US), and the other solution might be broader interconnection of grids. This is the European solution – for now. The free-market champion in Europe is increasingly Norway – who has not only the ff’s to benefit from with higher prices, but vast hydro capacity they are promoting as ‘the Norwegian battery.’
Regardless, I suspect Australia would need capacity markets long before hitting 20% renewables.
Texas would seem to, after surpassing only 10%.
This is one reason these comparisons are more entertaining than anything else. I enjoy the game, but … biomass is not really scalable – and the PV solution isn’t of interest to me as I’m in a Canadian climate where peak energy use is in the dark of winter (so 0 contribution at peak). Both PV and wind require other costs in the accounting – costs that are system dependent.
In Ontario, Canada (where I am), I’ve calculated the capacity costs, and the oversupply when we already have too much supply from must-run sources (primarily nuclear and hydro), takes wind from the $135/MWh we see to an estimated $263/MWh.
[…] http://bravenewclimate.com/2011/10/21/tcase15/#comment-139500 […]
More info needed on the new Queensland gas fired plants mentioned upthread http://www.brisbanetimes.com.au/queensland/its-a-gas-36-billion-investment-in-queensland-power-plants-20111025-1mhb8.html
$400m for each 500 MW plant is cheap but how much are they paying for gas? What expected capacity factor? Are they additional to and not replacing coal fired power stations? If so the carbon tax has fallen at the first hurdle of reducing national emissions. When we go to a CO2 cap some other emitters will have to close, that’s unless offsets conveniently bail us out.
Even bigger questions are;
-Does this mean no more coal fired plants in Australia?
-Will gas rich regions share with gas poor regions?
-Has coal had the quiet nod to concentrate on exports?
Apparently they expect the area around Gladstone to boom due to cheap energy. Without saying so perhaps they mean people will relocate from other parts of Australia. As in a million people leaving Sydney, Adelaide and Melbourne.
Call me a cynic but I believe certain State governments notably Queensland (with coal seam gas) and Victoria (brown coal) have not the slightest intention of helping achieve emissions cuts.
If I have done this correctly, Levy NNP pair seems to have an all-up capital cost estimate of up to US$10,180/Kw:
http://www.world-nuclear-news.org/NN-Construction_work_delayed_at_Levy_as_costs_rise-0705105.html
Now that is pricey power…
EL, 26 October 2011 at 5:55 AM
You reply is a bit confusing because it was you suggested that energy storage was viable to make wind generation viable. I responded and showed the cost of doing so, ie.e 106.9 billion /GW. Now you seem to be admitting that indeed wind plus storage is not viable and not even close. That was my point.
You say wind plus CAES is pretty close in cost to wind plus CCGT or coal.
I think you are wrong. But let’s see your assumptions and calculations.
This explains why I think you are wrong (based on PHES rather than CAES, but CAES is not widely used): http://bravenewclimate.com/2010/04/05/pumped-hydro-system-cost/#comment-86108 .
[…] Russell comments on actual wind vs. peak demand on BNC: Tom: Here’s a nice example of wind troughs matching demand peaks beautifully … from […]
The assumptions and calculations are fully documented in the paper I cited from 2007 (peer reviewed, and lead author CV here).
Short list of basic assumptions (it’s a very detailed and quantitatively rich analysis with lots of tables on capital, fixed O&M, variable O&M, fuel, converter, line losses, sensitivity studies, market and distribution costs, and other costs for total COE assessments):
Projections for wind farms coming on line in 2020 (3.5 MW rated output, 100m rotor diameter, 120m hub height, $700/kW cost in 2002 inflation adjusted US dollars, class 4 wind projections, 2.5 year construction period, capital charge rate 11%/year).
Model assumptions: 10% downtime during times of lowest demand (to charge storage units), generation at end of long, high voltage, transmission line (750 km), fully documented assumptions are made on wind speed time series, dispatch costs, and intra-hour market variations (no diurnal or seasonal variations were modeled).
Base case natural gas price: $5/GJ.
CAES storage reservoir assumptions (1 week storage): round trip efficiency 77-89%, underground storage volume ~2.4 x 10e7 m3/week of storage per GW, hard caverns require multiple excavations, aquifer storage assumes layer of 10m thickness and appropriate porosity, can run down to 5% of CAES output, cost of salt cavern ($1/kWh), aquifer (~$0.1/kWh), hard rock (~$30/kWh).
Here are sources for $750/kW cost projection for wind turbines in 2020: Neiji 1999, Junginger and Faaij 2003).
Author also includes extended commentary on where analysis needs to be expanded in future studies: seasonality of wind resource (and correlation with summer peak demand), outage rates (which may advantage wind + CAES), reliability of transmission (for transmission lengths above 750 km), availability of low-cost geologic reservoirs (and coincidence with wind resources), expanding geographic diversity of wind parks to lower supplemental generation costs, running configuration in intermediate-load configuration for higher market value per unit of energy, and more.
The problem about CAES is the considerable natural gas use – which is a fossil fuel leading to CO2 and methane that adds significantly to the GhG profile. Surprisingly, it’s only about 30% lower in natural gas use than a state of the art CCGT (60% efficient). This is ignoring the wind as energy input (ie assuming the wind electricity is free).
You need the adiabatic CAES version – using thermal energy storage – which is theoretical at this point. I’ve modelled a system that uses a huge bed of compartimented sand and rock as a thermal regenerator. It seems very promising. I hope it, or any adiabatic CAES will get developed.
Adiabatic CAES has higher capital costs per unit storage, due to the thermal energy storage component. So it makes more sense to use with a nuclear baseload grid, where less is needed than in an unreliable wind grid.
EL, on 27 October 2011 at 3:39 AM said:
Here are sources for $750/kW cost projection for wind turbines in 2020: Neiji 1999, Junginger and Faaij 2003).
Here is a US DOE 2010 report on cost projections for wind turbines
http://www.nrel.gov/docs/fy10osti/48007.pdf
Figure 5 illustrates the magnitude of the challenge faced by wind energy R&D to meet both energy capture and cost goals. Cohen et al. (2008) estimated that future technology advancements could reduce installed costs by as much as 30%, but modeling based purely on scaling today’s technology suggests installed cost could grow by as much as 80%.
We also have a 2008 report – key statement on page 33
http://eetd.lbl.gov/ea/ems/reports/lbnl-275e-ppt.pdf
Installed Project Costs Are On the Rise, After a Long Period of Decline
Following.
The baseload wind study looks to be consistent with Cohen et al. (2008), upon which this article is based. Cohen places installed costs at $981/kW in 2002 (for 1.5 MW turbine). A 30% cost reduction is $686/kW (which is more optimistic than wind baseload study). Most of these studies find only a modest decrease in future turbine cost, but a much larger decrease in cost of energy (when siting, O&M reductions, rotor size, hub height, and other performance characteristics are taken into account). They seem to be suggesting that manufacturing costs (i.e., “scaling today’s technology” and higher future costs for steel and copper) are going to contribute little to more significant technological and learning curve performance considerations for wind. Junginger (2006) makes the argument that “long-term supply contracts for raw materials” (p. 138) may help to reduce future escalation in raw materials costs.
@El,
I quoted –
scaling today’s technology suggests installed cost could grow by as much as 80%
I interpret that to mean that building larger turbines doesn’t necessarily mean a reduced cost per KWh and may actually increase costs by 80%.
In my simple mind It appears to be the force times moment arm problem.
A 3 MW turbine will need the tower and anchoring to be twice as strong as a 1.5 MW turbine only if the tower height remains the same.
So the cost per KW remains the same. As soon as you increase the tower height you need more then double the strength.
I note that this study is based on highly uncompetitive American style pirate power operations. Public power is far cheaper and more efficient.
For example, the US’s TVA is committed to nuke power.
Public power can finance construction cost with a 1% 5 year bond. Negligible cost.
Note the small difference between overnight and investment cost from an MIT report quoted here
http://nextbigfuture.com/2011/10/mit-energy-series-complains-about.html#more
Note as well that it really isn’t any cheaper to build most stuff in China. It’s regulation alone that makes western nukes more expensive. That could change overnight in the US when Obama gets the boot.
http://www.telegraph.co.uk/finance/comment/ambroseevans_pritchard/8844646/World-power-swings-back-to-America.html
Finally I’m still scratching my head as to why some wacky not yet built out on a limb proposal for offshore wind with costing designed to attract suckers as investors was chosen. There are lots of enormously expensive examples just built with real costs published in Europe like the Thanet Offshore Wind Farm at more the $16B/Gw.now a year old.
Also why choose first of a kind costs of the most expensive reactor on earth. The Candu provides excellent and recent examples of a fairly modern reactor built at $2B/Gw all around the world over the past few decades.
http://www.cnnc.com.cn/tabid/168/Default.aspx
Yes Seth, I used the most conservative approach possible for current nuclear builds, to show that even in this situation, it stills comes out as most cost effective. It makes for a good debating point that way…
Seth,
Thanks for that link – Candu 6, $2b/GW and 4.5 years construction period for Unit 1. That’s very good.
You mentioned that the Candu 6 has been built in many other countries recently. Could you list some and especially the Total capital cost per kW.
The Wiki entry on Candu reactors has quite a bit of information, including economics on different projects. Candu’s have seen their share of radiophobia incurred cost overruns just like most any reactor in north america, but despite all the screaming about cost overruns and rate payers risk and other exaggerted emotions, the simple numbers bear out that Candus are still quite competitive:
http://en.wikipedia.org/wiki/CANDU_reactor
Not as cheap as disgusting 19th century dirt burners, but perfectly affordable.
Cyril R,
Its pretty hard to extract anything meaningful from the Wikipedia article. I think ther have been no new Candu 6s, outside China, for a decade or more.
One of the advantages for Australia is that, at 700 MW, they would slot more easily into our grid than an AP1000 or larger. Another advantage is that we may ba able to avoid, so some extent, having to be involved with the US NRC licencing and regulatory system. So I am interested. But I would like to get some reliable capital cost figures from countries other than China. Do you or Seth have a link to any authoritative, relatively recent capital cost figures?
Various CANDUs have been succesfully constructed over the last few decades, as seen here:
http://www-pub.iaea.org/mtcd/meetings/PDFplus/2009/cn164/Sessions/09KS_ALIZADEH%20CANDU%20Technology%20IAEA%20Oct%202009.pdf
There are 4 units in South Korea and one in Argentina that were on budget. There are also succesfully built on buget units in Romania (Cernovada Nuclear Plant). They want to build more units but the economic crisis is hurting a lot.
http://www.democraticunderground.com/discuss/duboard.php?az=view_all&address=115×69318
A little different take – and one Seth might not appreciate, so I’ll note I’m citing testimony from the head of a private generator’s testimony at a Canadian Senate hearing in 2010: He’s looking for a long-term power purchase agreement (PPA) – where it should be provided (IMO), so this won’t offer an easy comparison, but …
The end of the question, from a Senator Mitchell, and then the response:
“What is the exact cost comparison between a new nuclear plant tomorrow in Southern Alberta and a new coal-fired plant in more or less the same region?”
Mr. Hawthorne: If I do a straightforward comparison, it is logical to compare the type of coal plant you could build in Alberta with the type of nuclear plant you could build there. It is already confirmed that in Alberta no coal plant can come on line after 2011 unless it has the ability to capture carbon. That is a government policy.
I work on the basis that the best economics right now involve carbon capture and sequestration, and the best numbers we have now come from a plant that is being developed in Weyburn, Saskatchewan, which range from $150 to $200 per megawatt. I can put a nuclear plant in Alberta for $100 to $110 per megawatt right now.
The challenge is that we are competitive with the future; we are not comparative with today. I have spoken at length with the premier and the energy minister of Alberta. The challenge is how to migrate from $40 to whatever that other number is.”
-http://www.parl.gc.ca/Content/SEN/Committee/403/enrg/07evb-e.htm?comm_id=5&Language=E&Parl=40&Ses=3
There’s some other points of interest in that testimony regarding the building of CANDUs in Romania and China.
Scott Luft — Thanks again. However, I’m having difficulty with a portion of Mr. Hawthorne’s response. Where the transcript states megawatt I have to assume he (menat/said) megawatt-hour.
Scott Luft @ 28 October 2011 at 11:20 PM
Thank you for that link to the Canadian Senate hearing.
The first thing that occurred to me is the contrast in the civility of Canadian Senators to each others compared with Australia Senators.
I’ve extracted this from the bit you quoted::
This quote gets to the nub of the issue.
Canada needs to get from $40 to $110/MWh for nuclear to be viable
Australia needs to get from $30 to $150/MWh for nuclear to be viable.
Alberta has 800 years of coal. Australia has similar.
Importantly, most of the population growth in coming decades will be in the developing countries. So it is those countries that need a cheap clean option. If we want to reduce world emissions we need to provide technologies that are cheap.
It is clear to me we need to reduce the cost of nuclear, not raise the bar on the fossil fuels. Because that will not help reduce world emissions – the developed world simply will not, cannot and should not build expensive power stations.
Regarding world population growth I saw this in a paper a couple of days ago:
World reached or will reach
1804 = 1 bn
1927 = 2 bn
1960 = 3 bn
1974 = 4 bn
1987 = 5 bn
1999 = 6 bn
31 October 2011 = 7 bn
2025 = 8 bn
2043 = 9 bn
2083 = 10 bn
The population distribution proportions in 1950 and projected distribution in 2150 are:
Asia = 55.6%; 57.1%
Africa = 8.8%; 23.7%
Latin America = 6.6%; 9.47%
Europe = 21.7%; 5.3%
North America = 6.8%; 4.1%
Oceania = 0.5%; 0.5%
No wonder Europe wants us all to adopt their CO2 Emissions Trading Scheme!!
The important point is that most of the population growth (and therefore emissions growth) is expected to be in Asia, Africa and Latin America. They will implement what ever energy supply is cheapest. We need to work on how to reduce the cost of nuclear, not raise the cost of fossil fuels, if we want to reduce world emissions.
Peter Lang,
This is exactly true, the only formula for guaranteed global success in replacing fossil fuels.
One important lower cost driver is nth of a kind economies from standardized nuclear reactors. We’ve seen that this has reduced the cost of the French reactors, they chose a few standardized reactors and just put the engineers in charge to build them. In other countries, the lawyers and managers were in charge, not the engineers, and insufficient standardization was involved.
Looking at the EPRs being built around the world, we see that newer projects are lower cost than the first EPR at Olkiluoto. That’s the nth of a kind economies sinking in. The same is happening with the AP1000 builds in China. In places like the USA this nth of a kind economy is not allowed because no new reactors are allowed to be built (by the infinite delay tactics from lawyers and regulators).
If we want to reduce the cost of nuclear, the nth of a kind reactor standardizing advantage is already happening on its own, its just a question of whether it will be allowed. In the US, the most important development in this respect is to abolish the NRC and replace it with an engineer-led organisation that is focuses on building many safe modern nuclear plants rather than infinitely delaying with absurdly long procedures. The concept of the final deadline must be introduced. All industrial regulators I know (and I know a lot of them) have deadlines. It is important to not put the lawyers and nontechnical managers in charge of such an organisation.
Cyril R,
I agree with you that nth of a kind gives us some cost reduction. But it’s not enough. We need a lot more. We need to halve the projected capital cost of nuclear to make nuclear viable in Australia.
I am not sure why the EPRI’s capital cost for nuclear is nearly twice the Total Plant Cost. It would be interesting to get to the bottom of that. It seems EPRI’s projected Total Plant Cost is consistent with the VC Summers cost when you allow for the fact that Australian labour productivity is lower and labour rates higher than in the USA. Also, the EPRI figures for Australia are for a Greenfield site whereas VC Summers is a brownfield site.
I think, but am not sure, EPRI used a 36 month construction period for an AP1000 as the basis for their estimates. If I am correct, their estimates are already for an nth of a kind construction period. The first NPPs in Australia would probably take 5 to six years if there is no public or industrial disruption.
The ACIL-Tasman (2009) report gave a reduction of about 11% from the first to the fifth power plant. The projected real LCOE (constant A$) drops from $96 to $87 – See Table 52 (p84), Nuclear, 2024-25 to 2028-29, here:
http://www.aemo.com.au/planning/419-0035.pdf
Over that same 5-year period, the capital cost drops by about 12% ($4,839 to $4,263) – see Table 35, p58.
Caution: these figures are out of date. The EPRI (2010) figures are the latest forecast for Australia. EPRI projects the LCOE of new nuclear would be $143/MWh (constant 2011 US$). That’s nearly five times the cost of electricity from the existing power stations.
I suggest, we need to look into the specifics of what is making the projected cost of nuclear far more expensive in Australia than the actual cost in Korea. Only a part of it can be blamed on Australian labour rates and productivity. There is more to it than just that. But what are the other impediments to low cost nuclear in Australia?
I don’t think labor rates make much of a difference. The Japanese were able to build their reactors on time on budget in the 1990s and they have very high labor costs. Regulatory ratcheting and regulatory/public suing culture delays seem to be the big factors in driving up the cost. The worst seems to be changes demanded by regulators when a project is already approved and they come with new ‘insights’ when something happens like Chernobyl or Three Mile Island or Fukushima. These cause painful delays to projects that have already broke ground, resulting to painful cost overruns such as requiring entire steam piping layouts to be changed when they’re already installed. The constantly changing requirements eliminated nth of a kind economies since all projects ended up being very different from previous designs.
Cohen explains it quite well in his book:
http://www.phyast.pitt.edu/~blc/book/chapter9.html
Considering the critical factors leading to delays leading to cost overruns, it is very important to go with a standardized design of which several have been built around the world already. This will result in minimal wheel reinventing and delays. So I think it is best to go with an ABWR, EPR or AP1000.
The inflation factor is something we have less control over, unfortunately. If the US for example keeps fighting rediculous wars and keeps the money press printing overtime, that hurts all capital intensive projects whether coal or nuclear. That in turn increases the incentive to keep old exisiting dirt burners running, which is of course disgusting.
It is not possible to compete with old coal plants that use sub-BAT pollutant abatement, that do nothing about CO2 emissions, and that have already paid off their construction costs.
If purely looking at the raw financial cost factors then I am not optimistic about nuclear new build anywhere. Even in China its only marginally economic, with slave labour camps to mine the coal you can’t compete with that. Nuclear plants may cost half the amount in China as in most western countries, but so do coal plants. I suspect the only reason the Chinese are doing it right now is that they need all the energy they can get and even then it won’t be enough. They have no luxury of choice.
It requires a supportive country with a pragmatic regulatory body instated to get a speedy transition to nuclear. Finland is a great example. People don’t realize it but Finland is transitioning to >70% nuclear over the next 10 years. Everyone likes to talk about the economic failure of Olkiluoto’s EPR but the fact is despite all the cost overruns it now makes 4 euros per Watt which means it generates power for 7-8 eurocents per kWh which is perfectly affordable (currently European wholesale prices for a flat block of power trade for about this price).
@David Benson – that’s true. Mr. Hawthorne may have adjusted to the terms as the Senators were using them. It’s almost always MWh.
@Peter Lang, I think most comments I’d like to make will be more appropriate on the open thread. I recalled the cited testimony because a firm price was given. Rereading it now, in the context of a number of BNC conversations, it also noted the fuel costs (choice of uranium), it touched on the scale of NPP’s increasing specifically due to a need to spread an, implicitly, high regulatory costs, and it also provides a warning that smaller scale, desirably modular, NPPs won’t be feasible without an adjustment in the regulatory regimes.
Regulation is not simply determining price, but also reducing technological options.
Cyril R. — Actually (although almost unknown to the general public), TVA currently has an NPP under construction. Furthermore, the construction phase on not one but for Westinghouse AP-1000s will begin within a few moths; Westinghouse has already let the contract for the transformers.
[All of that comes for World Nuclear News, which I encourage you to follow several times a week.]
Cyril R @ 29 October 2011 at 9:51 PM
Thank you for those comments. What I am seeking is a drill-down to understand why the capital cost of new new nuclear in Australia would be around four times higher than in Korea. All you have written in your comment is correct, but we’ve been over all that level of generality many times before. There are a lot of comments on this, and some drill down one level, on the “Alternative to Carbon Pricing” thread. My main point is that if we want to seriously consider nuclear in Australia we need to:
• Identify all the impediments to low-cost nuclear in Australia, and all the energy market distortions
• Identify which could be removed
• Prioritise them for removal
• Define policy options for removing them
• Define what else would be needed to get nuclear through to the “settled down costs” (in Australia) stage
See this for some background:
Nuclear cheaper than coal in Australia. How?
http://bravenewclimate.com/2010/01/31/alternative-to-cprs/#comment-109491
Further Reading
Some impediments to low-cost nuclear
http://bravenewclimate.com/2010/01/31/alternative-to-cprs/#comment-86256
Subsidies that encourage fossil fuel use in Australia.
http://www.isf.uts.edu.au/publications/CR_2003_paper.pdf
Impediments to low-cost nuclear – Industrial Relations
http://bravenewclimate.com/2010/01/31/alternative-to-cprs/#comment-110185
The excessive cost due to regulatory ratcheting
http://www.phyast.pitt.edu/~blc/book/chapter9.html
Suggested Terms of Reference for a “Productivity Commission” Investigation into the impediments to low-cost nuclear
http://bravenewclimate.com/2010/01/31/alternative-to-cprs/#comment-109732
How to remove investor risk premium:
http://bravenewclimate.com/2010/01/31/alternative-to-cprs/#comment-111683
Emissions monitoring – the cost. Is this the best way?
http://bravenewclimate.com/2010/01/31/alternative-to-cprs/#comment-113058
A list of some key comments on the “Alternative to Carbon Pricing” thread:
http://bravenewclimate.com/2010/01/31/alternative-to-cprs/#comment-110262
Scott Luft,
Very important points. But not something Australia can do anything about – other than, perhaps base our future system on one that is not dependent on US NRC regulation.
I think we should seriously consider looking into how we could avoide being tied into the NRC for waht would amount to a very long “life sentence”. Options might be (although I have no idea about this at all):
– Canada
– Finland or Sweden or UK
– Korea
– China.
Let’s just come at this with an open mind.
Peter Lang — For a variety of reasons I suggest using the UK regulatory methods. Of course, the first goal IMHO is to win at least 3/4 voter acceptance of the very thought of NPPs.
David B Bensaon,
the construction phase on not one but four Westinghouse AP-1000s will begin within a few months
Photo’s and video’s from Plant Vogtle. .
http://www.southerncompany.com/nuclearenergy/photos.aspx
I’m not sure what they call what they are doing…but the latest photo shows them assembling the bottom plate of the containment structure
@Cyril
If purely looking at the raw financial cost factors then I am not optimistic about nuclear new build anywhere. Even in China its only marginally economic, with slave labour camps to mine the coal you can’t compete with that
Mine Mouth coal prices in China are higher then domestic coal prices in Australia or the US.
Article on mine mouth coal prices in China for September 2011
http://www.chinamining.org/News/2011-09-28/1317194184d49992.html
625 CNY/tonne for 5500 kcal/kg coal (US $98)
410 CNY/tonne for 4800 kcal/kg coal.(US $64)
.
The mine mouth price of the US equivalent of 4800 kcal/kg(8500 Btu/lb) coal is $14/ton.
2008 Chinese coal mining presentation
http://www.egcfe.ewg.apec.org/publications/proceedings/CFE/Korea_2009/%28Session%201%29Coal%20Demand-Supply%20Outlook%20in%20China.pdf
In 2008 there were 5.5 million Chinese coal miners that produced 2.8 billion tonnes of coal. An average of 505 tons per man per year.
In the US in 2009 the coal industry employed 87,000 and produced 1.1 billion tons of coal. An average of 12,600 tons per man per year.
24 times as productive as a Chinese coal miner.
harrywr2 — Fascinating. I’m surprised that NRC has allowed the bottom plate construction to proceed. However so-called constuction does not begin until containment concrete is poured; my understanding is that must wait until the COL is issued, in a couple of months I think.
Actually Scott if you reread the parliamentary paper and exclude the nonsense for Hawthorne you will see this line which corresponds to the ACTUAL REAL costs of the last few Candu builds
He was consistently mixing up megawatt and megawatt hours something no engineer would do.
From the minutes
” , the capital cost is $2,000 per kilowatt for nuclear…..ceri report”
(Personal attack deleted)
http://www.yourrenewablenews.com/news_item.php?newsID=5388
Once again 2000 to 2500 per kilowatt.
Public power finances at less than 5% so $2B/Gw translates to a 1.3 cents a kwh on 40 year money.
(Personal attacks deleted)
MODERATOR
BNC Comments Policy require you to attack the arguments not the man.
Seth,
Thank you for the link.
Pardon my scepticism, but I don’t consider this is credible. I suspect it is a case of a proponent giving a low-ball estimate for the Total Plant Cost not the Total Capital Required.
I find it difficult to believe Alberta will make the decision to go nuclear when it has so much coal. I would expect the first regions to build new nuclear plants would be those where there is little or no coal and the majority of industry is located; Ontario and Quebec.
Seth @ 31 October 2011 at 5:25 AM
But you forgot to include the link. Could you also say where to find this line.
Also, could you provide a link to the CERI report and point to the pages you are referring to. I’d like to see, if you have a reference, a list of the recent CANDU builds, the total capital costs for each, the dates when the order was signed, construction started, construction completed, commissioned, start of commercial operation, lifetime capacity factor to date.
Peter Lang, on 31 October 2011 at 8:27 AM said:
I find it difficult to believe Alberta will make the decision to go nuclear when it has so much coal. I would expect the first regions to build new nuclear plants would be those where there is little or no coal and the majority of industry is located; Ontario and Quebec.
Canadian Generating Capacity by provide.
http://www.electricity.ca/media/pdfs/INdustry%20data/Electric%20Generating%20Capacity%20in%20Canada%20by%20Province%20and%20Fuel%20Type%20%28Table-GW%29,%202008.pdf
Ontario has 12 GW of nuclear already and Quebec has plenty of hydro.
Alberta’s energy consumption is skyrocketing due to oil sands processing.
Harrywr2,
Thank you for the link. I did say “the first regions to build new nuclear plants”.
What I meant was Ontario and Quebec do not have access to huge, low cost coal resources like Alberta. Therefore, nuclear is closer to being competitive with coal in Ontario and Quebec than in Alberta. Nuclear at $110/MWh has to compete with coal at $40/MWh in Alberta. So if the nuclear proponents can’t make new nuclear attractive in Ontario an Quebec (and you have to admit they are struggling to demonstrate it is viable) then it has no hope in Alberta – unless, of course, the government implements “direct action” policies to make it so!
Peter
I included the link in my first post.
Here is a link to a new nonsequestered Pirate coal facility in Calgary,’
We have 500-megawatt state of the art coal plant at $1.7-billion. According to EIA the capacity factor of these monstrosities is 63%. A filthy radioactive,deadly particulate, GHG, NOX and radioactive radon gas spewing monstrosity of a plant leaving as a class enough forever toxic deadly radioactive arsenic and mercury laced ash to fill Lake Erie 40 feet deep every year.
Lets see $5.4B/Gw + 4 cents kwh for fuel and maintenance financed at Pirate Power’s Wall Street demanded Alberta PUC approved 12% discount rate comes out to 12 cents a kwh.
http://www.theglobeandmail.com/report-on-business/industry-news/energy-and-resources/coal-power-plant-races-against-regulation/article2090435/
A nuke plant built in Alberta by public power provider EPCOR would cost around 3 cents a kwh.
Big Oil however owns every politician in Alberta and most in the Federal neoCons party so not a likely scenario.
[…] Then there is this comment by Tom Blees, putting recent solar costs into context (see also my recent comparison in TCASE 15): […]
[…] Mandates and Electric Generation CostsCEDA report on Australia’s nuclear energy optionsTCASE 15: Comparison of four ‘clean energy’ projects var topsy_style = ‘big’; var topsy_nick = ”; var topsy_order = ‘count,badge,retweet’; var […]
information you provide is very useful. thank you